Version 2.2.0
import matplotlib.pyplot as plt
import numpy as np
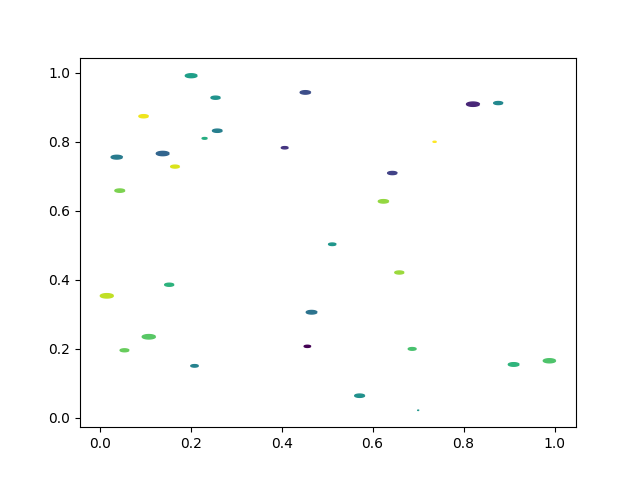
# unit area ellipse
rx, ry = 3., 1.
area = rx * ry * np.pi
theta = np.arange(0, 2 * np.pi + 0.01, 0.1)
verts = np.column_stack([rx / area * np.cos(theta), ry / area * np.sin(theta)])
x, y, s, c = np.random.rand(4, 30)
s *= 10**2.
fig, ax = plt.subplots()
ax.scatter(x, y, s, c, marker=None, verts=verts)
plt.show()