Version 2.2.0
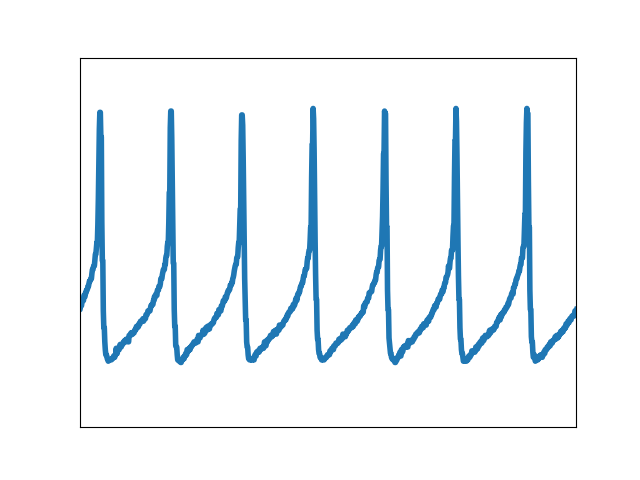
This example reproduces the frontpage simple plot example.
import matplotlib.pyplot as plt
import matplotlib.cbook as cbook
import numpy as np


with cbook.get_sample_data('membrane.dat') as datafile:
    x = np.fromfile(datafile, np.float32)
# 0.0005 is the sample interval

fig, ax = plt.subplots()
ax.plot(x, linewidth=4)
ax.set_xlim(5000, 6000)
ax.set_ylim(-0.6, 0.1)
ax.set_xticks([])
ax.set_yticks([])
fig.savefig("membrane_frontpage.png", dpi=25)  # results in 160x120 px image