Version 2.2.0
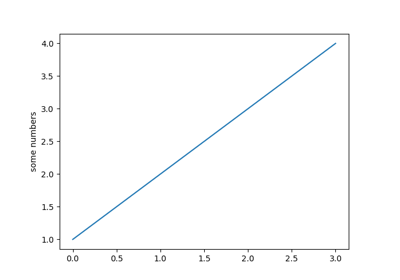
matplotlib.pyplot.ylim(*args, **kwargs)¶Get or set the y-limits of the current axes.
ymin, ymax = ylim()   # return the current ylim
ylim( (ymin, ymax) )  # set the ylim to ymin, ymax
ylim( ymin, ymax )    # set the ylim to ymin, ymax
If you do not specify args, you can pass the ymin and ymax as kwargs, e.g.:
ylim(ymax=3) # adjust the max leaving min unchanged
ylim(ymin=1) # adjust the min leaving max unchanged
Setting limits turns autoscaling off for the y-axis.
The new axis limits are returned as a length 2 tuple.
matplotlib.pyplot.ylim