Version 2.2.0
matplotlib.pyplot.specgram(x, NFFT=None, Fs=None, Fc=None, detrend=None, window=None, noverlap=None, cmap=None, xextent=None, pad_to=None, sides=None, scale_by_freq=None, mode=None, scale=None, vmin=None, vmax=None, hold=None, data=None, **kwargs)¶Plot a spectrogram.
Call signature:
specgram(x, NFFT=256, Fs=2, Fc=0, detrend=mlab.detrend_none,
         window=mlab.window_hanning, noverlap=128,
         cmap=None, xextent=None, pad_to=None, sides='default',
         scale_by_freq=None, mode='default', scale='default',
         **kwargs)
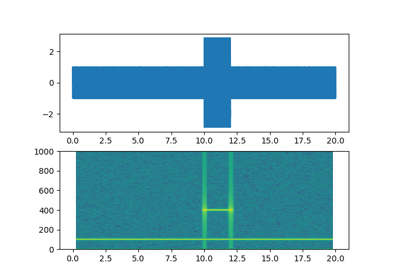
Compute and plot a spectrogram of data in x. Data are split into NFFT length segments and the spectrum of each section is computed. The windowing function window is applied to each segment, and the amount of overlap of each segment is specified with noverlap. The spectrogram is plotted as a colormap (using imshow).
| Parameters: | x : 1-D array or sequence
Fs : scalar
window : callable or ndarray
sides : [ ‘default’ | ‘onesided’ | ‘twosided’ ]
pad_to : integer
NFFT : integer
detrend : {‘default’, ‘constant’, ‘mean’, ‘linear’, ‘none’} or callable
scale_by_freq : boolean, optional
mode : [ ‘default’ | ‘psd’ | ‘magnitude’ | ‘angle’ | ‘phase’ ]
noverlap : integer
scale : [ ‘default’ | ‘linear’ | ‘dB’ ]
Fc : integer
cmap :
xextent : [None | (xmin, xmax)]
**kwargs :
|
|---|---|
| Returns: | spectrum : 2-D array
freqs : 1-D array
t : 1-D array
im : instance of class
|
See also
psd()psd() differs in the default overlap; in returning the mean of the segment periodograms; in not returning times; and in generating a line plot instead of colormap.magnitude_spectrum()angle_spectrum()phase_spectrum()Notes
The parameters detrend and scale_by_freq do only apply when mode is set to ‘psd’.
Note
In addition to the above described arguments, this function can take a data keyword argument. If such a data argument is given, the following arguments are replaced by data[<arg>]:
matplotlib.pyplot.specgram