You are reading an old version of the documentation (v2.2.0). For the latest version see https://matplotlib.org/stable/api/_as_gen/matplotlib.pyplot.axvline.html
Version 2.2.0
matplotlib
Fork me on GitHub

Table Of Contents

This Page

matplotlib.pyplot.axvline

matplotlib.pyplot.axvline(x=0, ymin=0, ymax=1, hold=None, **kwargs)

Add a vertical line across the axes.

Parameters:

x : scalar, optional, default: 0

x position in data coordinates of the vertical line.

ymin : scalar, optional, default: 0

Should be between 0 and 1, 0 being the bottom of the plot, 1 the top of the plot.

ymax : scalar, optional, default: 1

Should be between 0 and 1, 0 being the bottom of the plot, 1 the top of the plot.

Returns:

Line2D

Other Parameters:
 

**kwargs :

Valid kwargs are Line2D properties, with the exception of ‘transform’:

Property Description
agg_filter a filter function, which takes a (m, n, 3) float array and a dpi value, and returns a (m, n, 3) array
alpha float (0.0 transparent through 1.0 opaque)
animated bool
antialiased or aa bool
clip_box a Bbox instance
clip_on bool
clip_path [(Path, Transform) | Patch | None]
color or c any matplotlib color
contains a callable function
dash_capstyle [‘butt’ | ‘round’ | ‘projecting’]
dash_joinstyle [‘miter’ | ‘round’ | ‘bevel’]
dashes sequence of on/off ink in points
drawstyle [‘default’ | ‘steps’ | ‘steps-pre’ | ‘steps-mid’ | ‘steps-post’]
figure a Figure instance
fillstyle [‘full’ | ‘left’ | ‘right’ | ‘bottom’ | ‘top’ | ‘none’]
gid an id string
label object
linestyle or ls [‘solid’ | ‘dashed’, ‘dashdot’, ‘dotted’ | (offset, on-off-dash-seq) | '-' | '--' | '-.' | ':' | 'None' | ' ' | '']
linewidth or lw float value in points
marker A valid marker style
markeredgecolor or mec any matplotlib color
markeredgewidth or mew float value in points
markerfacecolor or mfc any matplotlib color
markerfacecoloralt or mfcalt any matplotlib color
markersize or ms float
markevery [None | int | length-2 tuple of int | slice | list/array of int | float | length-2 tuple of float]
path_effects AbstractPathEffect
picker float distance in points or callable pick function fn(artist, event)
pickradius float distance in points
rasterized bool or None
sketch_params (scale: float, length: float, randomness: float)
snap bool or None
solid_capstyle [‘butt’ | ‘round’ | ‘projecting’]
solid_joinstyle [‘miter’ | ‘round’ | ‘bevel’]
transform a matplotlib.transforms.Transform instance
url a url string
visible bool
xdata 1D array
ydata 1D array
zorder float

See also

vlines
Add vertical lines in data coordinates.
axvspan
Add a vertical span (rectangle) across the axis.

Examples

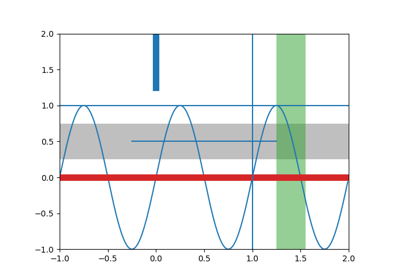
  • draw a thick red vline at x = 0 that spans the yrange:

    >>> axvline(linewidth=4, color='r')
    
  • draw a default vline at x = 1 that spans the yrange:

    >>> axvline(x=1)
    
  • draw a default vline at x = .5 that spans the middle half of the yrange:

    >>> axvline(x=.5, ymin=0.25, ymax=0.75)
    

Examples using matplotlib.pyplot.axvline