Version 2.2.0
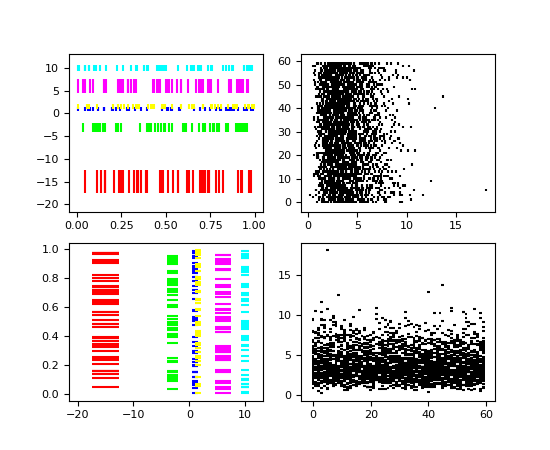
Axes.eventplot(positions, orientation='horizontal', lineoffsets=1, linelengths=1, linewidths=None, colors=None, linestyles='solid', *, data=None, **kwargs)¶Plot identical parallel lines at the given positions.
positions should be a 1D or 2D array-like object, with each row corresponding to a row or column of lines.
This type of plot is commonly used in neuroscience for representing neural events, where it is usually called a spike raster, dot raster, or raster plot.
However, it is useful in any situation where you wish to show the timing or position of multiple sets of discrete events, such as the arrival times of people to a business on each day of the month or the date of hurricanes each year of the last century.
| Parameters: | positions : 1D or 2D array-like object
orientation : {‘horizontal’, ‘vertical’}, optional
lineoffsets : scalar or sequence of scalars, optional, default: 1
linelengths : scalar or sequence of scalars, optional, default: 1
linewidths : scalar, scalar sequence or None, optional, default: None
colors : color, sequence of colors or None, optional, default: None
linestyles : str or tuple or a sequence of such values, optional
**kwargs : optional
|
|---|---|
| Returns: | A list of were added. |
Notes
For linelengths, linewidths, colors, and linestyles, if only a single value is given, that value is applied to all lines. If an array-like is given, it must have the same length as positions, and each value will be applied to the corresponding row of the array.
Examples
(Source code, png, pdf)
Note
In addition to the above described arguments, this function can take a data keyword argument. If such a data argument is given, the following arguments are replaced by data[<arg>]: