Version 2.1.2
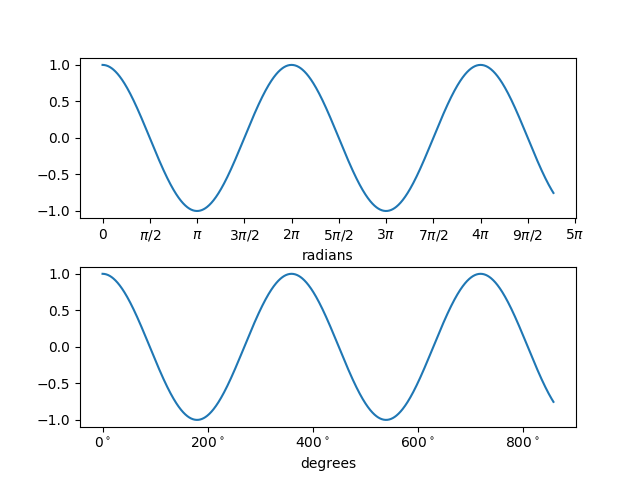
Plot with radians from the basic_units mockup example package.
This example shows how the unit class can determine the tick locating, formatting and axis labeling.
This example requires basic_units.py
import numpy as np
from basic_units import radians, degrees, cos
from matplotlib.pyplot import figure, show

x = [val*radians for val in np.arange(0, 15, 0.01)]

fig = figure()
fig.subplots_adjust(hspace=0.3)

ax = fig.add_subplot(211)
line1, = ax.plot(x, cos(x), xunits=radians)

ax = fig.add_subplot(212)
line2, = ax.plot(x, cos(x), xunits=degrees)

show()
Total running time of the script: ( 0 minutes 0.216 seconds)
