Version 2.1.2
import numpy as np
import matplotlib.pyplot as plt
box = dict(facecolor='yellow', pad=5, alpha=0.2)
fig = plt.figure()
fig.subplots_adjust(left=0.2, wspace=0.6)
# Fixing random state for reproducibility
np.random.seed(19680801)
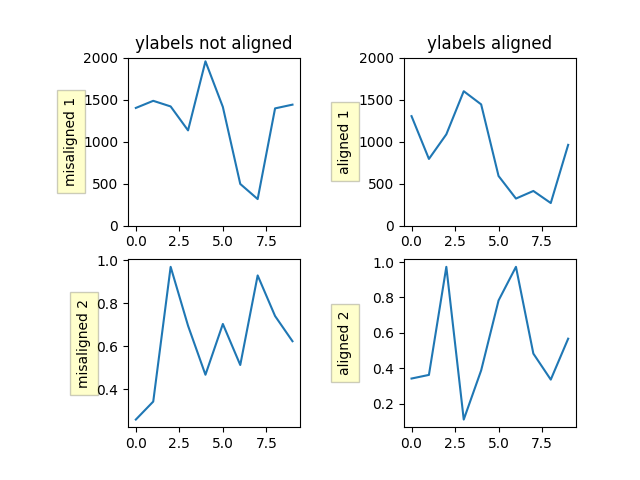
ax1 = fig.add_subplot(221)
ax1.plot(2000*np.random.rand(10))
ax1.set_title('ylabels not aligned')
ax1.set_ylabel('misaligned 1', bbox=box)
ax1.set_ylim(0, 2000)
ax3 = fig.add_subplot(223)
ax3.set_ylabel('misaligned 2',bbox=box)
ax3.plot(np.random.rand(10))
labelx = -0.3 # axes coords
ax2 = fig.add_subplot(222)
ax2.set_title('ylabels aligned')
ax2.plot(2000*np.random.rand(10))
ax2.set_ylabel('aligned 1', bbox=box)
ax2.yaxis.set_label_coords(labelx, 0.5)
ax2.set_ylim(0, 2000)
ax4 = fig.add_subplot(224)
ax4.plot(np.random.rand(10))
ax4.set_ylabel('aligned 2', bbox=box)
ax4.yaxis.set_label_coords(labelx, 0.5)
plt.show()
Total running time of the script: ( 0 minutes 0.072 seconds)
