Version 2.1.2
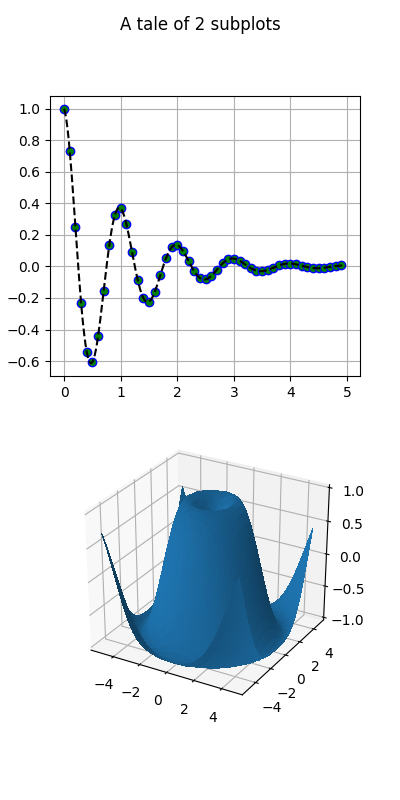
This example shows a how to plot a 2D and 3D plot on the same figure.
from mpl_toolkits.mplot3d import Axes3D
import matplotlib.pyplot as plt
import numpy as np


def f(t):
    s1 = np.cos(2*np.pi*t)
    e1 = np.exp(-t)
    return np.multiply(s1, e1)


# Set up a figure twice as tall as it is wide
fig = plt.figure(figsize=plt.figaspect(2.))
fig.suptitle('A tale of 2 subplots')

# First subplot
ax = fig.add_subplot(2, 1, 1)

t1 = np.arange(0.0, 5.0, 0.1)
t2 = np.arange(0.0, 5.0, 0.02)
t3 = np.arange(0.0, 2.0, 0.01)

ax.plot(t1, f(t1), 'bo',
        t2, f(t2), 'k--', markerfacecolor='green')
ax.grid(True)
ax.set_ylabel('Damped oscillation')

# Second subplot
ax = fig.add_subplot(2, 1, 2, projection='3d')

X = np.arange(-5, 5, 0.25)
Y = np.arange(-5, 5, 0.25)
X, Y = np.meshgrid(X, Y)
R = np.sqrt(X**2 + Y**2)
Z = np.sin(R)

surf = ax.plot_surface(X, Y, Z, rstride=1, cstride=1,
                       linewidth=0, antialiased=False)
ax.set_zlim(-1, 1)

plt.show()
Total running time of the script: ( 0 minutes 0.081 seconds)
