Version 2.1.2
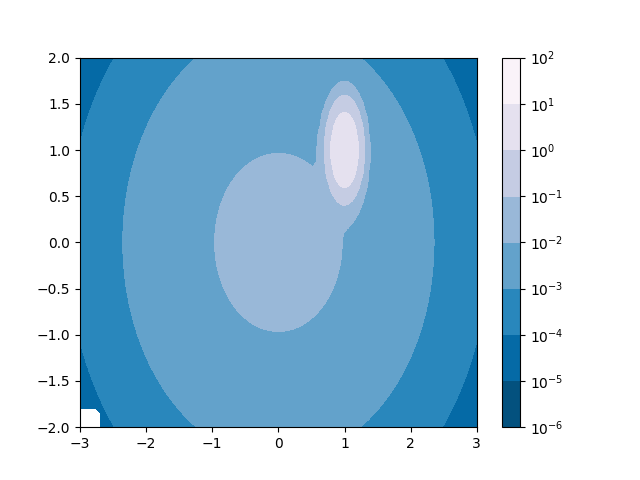
Demonstrate use of a log color scale in contourf
import matplotlib.pyplot as plt
import numpy as np
from numpy import ma
from matplotlib import ticker, cm
from matplotlib.mlab import bivariate_normal

N = 100
x = np.linspace(-3.0, 3.0, N)
y = np.linspace(-2.0, 2.0, N)

X, Y = np.meshgrid(x, y)

# A low hump with a spike coming out of the top right.
# Needs to have z/colour axis on a log scale so we see both hump and spike.
# linear scale only shows the spike.
z = (bivariate_normal(X, Y, 0.1, 0.2, 1.0, 1.0)
     + 0.1 * bivariate_normal(X, Y, 1.0, 1.0, 0.0, 0.0))

# Put in some negative values (lower left corner) to cause trouble with logs:
z[:5, :5] = -1

# The following is not strictly essential, but it will eliminate
# a warning.  Comment it out to see the warning.
z = ma.masked_where(z <= 0, z)


# Automatic selection of levels works; setting the
# log locator tells contourf to use a log scale:
fig, ax = plt.subplots()
cs = ax.contourf(X, Y, z, locator=ticker.LogLocator(), cmap=cm.PuBu_r)

# Alternatively, you can manually set the levels
# and the norm:
#lev_exp = np.arange(np.floor(np.log10(z.min())-1),
#                    np.ceil(np.log10(z.max())+1))
#levs = np.power(10, lev_exp)
#cs = P.contourf(X, Y, z, levs, norm=colors.LogNorm())

# The 'extend' kwarg does not work yet with a log scale.

cbar = fig.colorbar(cs)

plt.show()
Total running time of the script: ( 0 minutes 0.047 seconds)
