Version 2.1.2
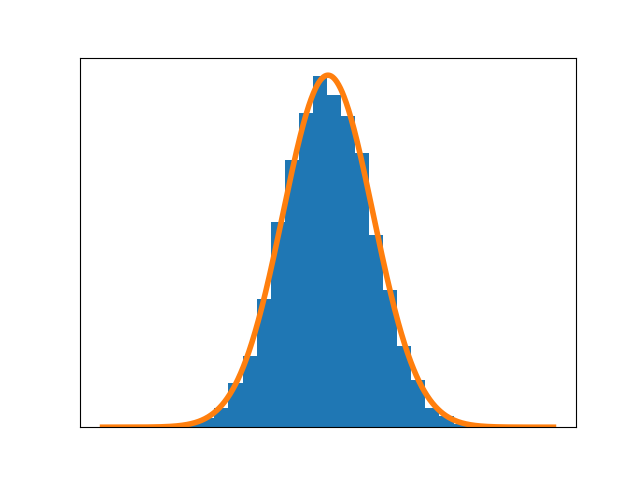
This example reproduces the frontpage histogram example.
import matplotlib.pyplot as plt
import numpy as np


random_state = np.random.RandomState(19680801)
X = random_state.randn(10000)

fig, ax = plt.subplots()
ax.hist(X, bins=25, normed=True)
x = np.linspace(-5, 5, 1000)
ax.plot(x, 1 / np.sqrt(2*np.pi) * np.exp(-(x**2)/2), linewidth=4)
ax.set_xticks([])
ax.set_yticks([])
fig.savefig("histogram_frontpage.png", dpi=25)  # results in 160x120 px image
Total running time of the script: ( 0 minutes 0.041 seconds)
