Version 2.1.2
import matplotlib.pyplot as plt
from mpl_toolkits.axes_grid1.inset_locator import inset_axes, zoomed_inset_axes
from mpl_toolkits.axes_grid1.colorbar import colorbar
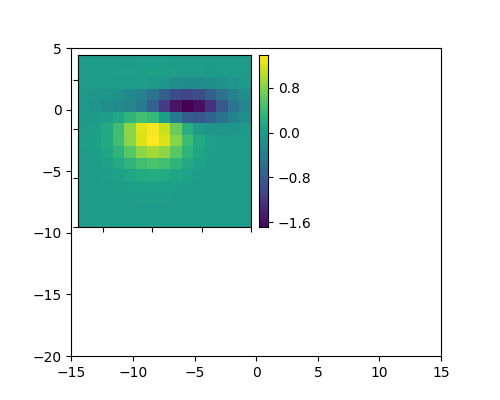
def get_demo_image():
from matplotlib.cbook import get_sample_data
import numpy as np
f = get_sample_data("axes_grid/bivariate_normal.npy", asfileobj=False)
z = np.load(f)
# z is a numpy array of 15x15
return z, (-3, 4, -4, 3)
fig, ax = plt.subplots(figsize=[5, 4])
Z, extent = get_demo_image()
ax.set(aspect=1,
xlim=(-15, 15),
ylim=(-20, 5))
axins = zoomed_inset_axes(ax, 2, loc=2) # zoom = 6
im = axins.imshow(Z, extent=extent, interpolation="nearest",
origin="lower")
plt.xticks(visible=False)
plt.yticks(visible=False)
# colorbar
cax = inset_axes(axins,
width="5%", # width = 10% of parent_bbox width
height="100%", # height : 50%
loc=3,
bbox_to_anchor=(1.05, 0., 1, 1),
bbox_transform=axins.transAxes,
borderpad=0,
)
colorbar(im, cax=cax)
plt.show()
Total running time of the script: ( 0 minutes 0.066 seconds)
