Version 2.1.2
Use colorbar by specifying the mappable object (here the imshow returned object) and the axes to attach the colorbar to.
import numpy as np
import matplotlib.pyplot as plt
# setup some generic data
N = 37
x, y = np.mgrid[:N, :N]
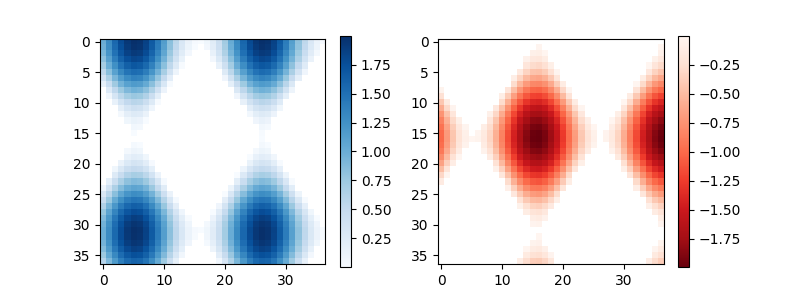
Z = (np.cos(x*0.2) + np.sin(y*0.3))
# mask out the negative and positve values, respectively
Zpos = np.ma.masked_less(Z, 0)
Zneg = np.ma.masked_greater(Z, 0)
fig, (ax1, ax2) = plt.subplots(figsize=(8, 3), ncols=2)
# plot just the positive data and save the
# color "mappable" object returned by ax1.imshow
pos = ax1.imshow(Zpos, cmap='Blues', interpolation='none')
# add the colorbar using the figure's method,
# telling which mappable we're talking about and
# which axes object it should be near
fig.colorbar(pos, ax=ax1)
# repeat everything above for the negative data
neg = ax2.imshow(Zneg, cmap='Reds_r', interpolation='none')
fig.colorbar(neg, ax=ax2)
plt.show()
Total running time of the script: ( 0 minutes 0.078 seconds)
