Version 2.1.2
matplotlib.pyplot.stem(*args, **kwargs)¶Create a stem plot.
Call signatures:
stem(y, linefmt='b-', markerfmt='bo', basefmt='r-')
stem(x, y, linefmt='b-', markerfmt='bo', basefmt='r-')
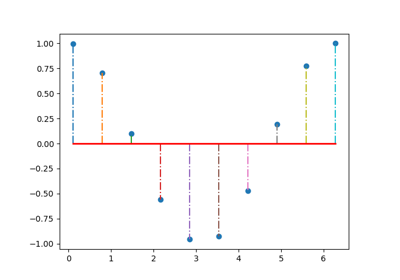
A stem plot plots vertical lines (using linefmt) at each x location from the baseline to y, and places a marker there using markerfmt. A horizontal line at 0 is plotted using basefmt.
If no x values are provided, the default is (0, 1, …, len(y) - 1)
Return value is a tuple (markerline, stemlines,
baseline). See StemContainer
See also
This document for details.
Note
In addition to the above described arguments, this function can take a data keyword argument. If such a data argument is given, the following arguments are replaced by data[<arg>]: