Version 2.1.2
matplotlib.pyplot.setp(*args, **kwargs)¶Set a property on an artist object.
matplotlib supports the use of setp() (“set property”) and
getp() to set and get object properties, as well as to do
introspection on the object. For example, to set the linestyle of a
line to be dashed, you can do:
>>> line, = plot([1,2,3])
>>> setp(line, linestyle='--')
If you want to know the valid types of arguments, you can provide the name of the property you want to set without a value:
>>> setp(line, 'linestyle')
    linestyle: [ '-' | '--' | '-.' | ':' | 'steps' | 'None' ]
If you want to see all the properties that can be set, and their possible values, you can do:
>>> setp(line)
    ... long output listing omitted
You may specify another output file to setp if sys.stdout is not
acceptable for some reason using the file keyword-only argument:
>>> with fopen('output.log') as f:
>>>     setp(line, file=f)
setp() operates on a single instance or a iterable of
instances. If you are in query mode introspecting the possible
values, only the first instance in the sequence is used. When
actually setting values, all the instances will be set. e.g.,
suppose you have a list of two lines, the following will make both
lines thicker and red:
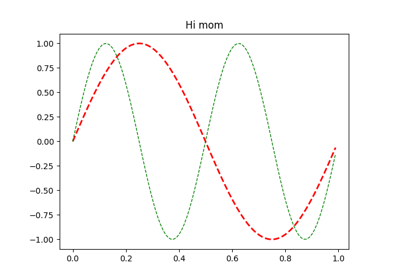
>>> x = arange(0,1.0,0.01)
>>> y1 = sin(2*pi*x)
>>> y2 = sin(4*pi*x)
>>> lines = plot(x, y1, x, y2)
>>> setp(lines, linewidth=2, color='r')
setp() works with the MATLAB style string/value pairs or
with python kwargs. For example, the following are equivalent:
>>> setp(lines, 'linewidth', 2, 'color', 'r')  # MATLAB style
>>> setp(lines, linewidth=2, color='r')        # python style
matplotlib.pyplot.setp