Version 2.1.2
matplotlib.pyplot.axis(*v, **kwargs)¶Convenience method to get or set axis properties.
Calling with no arguments:
>>> axis()
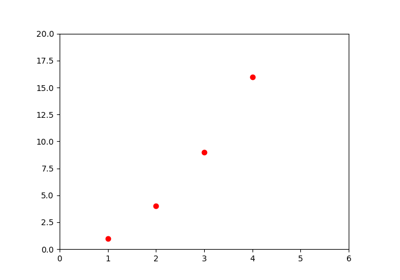
returns the current axes limits [xmin, xmax, ymin, ymax].:
>>> axis(v)
sets the min and max of the x and y axes, with
v = [xmin, xmax, ymin, ymax].:
>>> axis('off')
turns off the axis lines and labels.:
>>> axis('equal')
changes limits of x or y axis so that equal increments of x and y have the same length; a circle is circular.:
>>> axis('scaled')
achieves the same result by changing the dimensions of the plot box instead of the axis data limits.:
>>> axis('tight')
changes x and y axis limits such that all data is shown. If all data is already shown, it will move it to the center of the figure without modifying (xmax - xmin) or (ymax - ymin). Note this is slightly different than in MATLAB.:
>>> axis('image')
is ‘scaled’ with the axis limits equal to the data limits.:
>>> axis('auto')
and:
>>> axis('normal')
are deprecated. They restore default behavior; axis limits are automatically scaled to make the data fit comfortably within the plot box.
if len(*v)==0, you can pass in xmin, xmax, ymin, ymax
as kwargs selectively to alter just those limits without changing
the others.
>>> axis('square')
changes the limit ranges (xmax-xmin) and (ymax-ymin) of the x and y axes to be the same, and have the same scaling, resulting in a square plot.
The xmin, xmax, ymin, ymax tuple is returned
matplotlib.pyplot.axis