This shows 4 possible projections using subplot. Matplotlib also supports Basemaps Toolkit and Cartopy for geographic projections.
import matplotlib.pyplot as plt
plt.figure()
plt.subplot(111, projection="aitoff")
plt.title("Aitoff")
plt.grid(True)

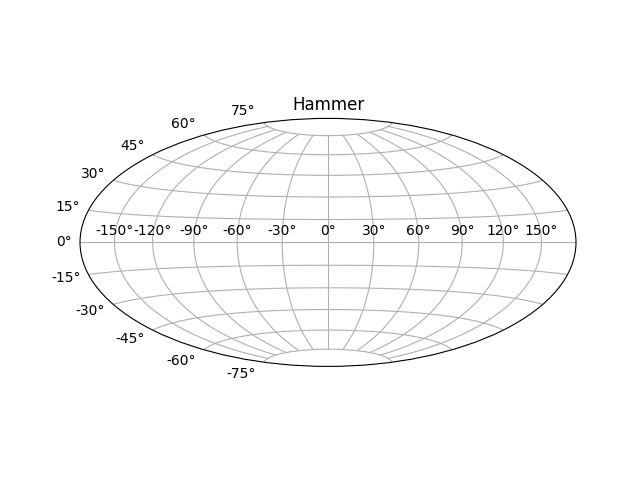
plt.figure()
plt.subplot(111, projection="hammer")
plt.title("Hammer")
plt.grid(True)
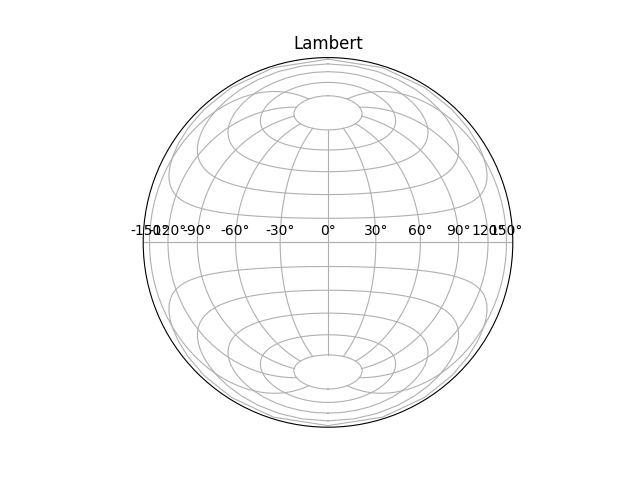
plt.figure()
plt.subplot(111, projection="lambert")
plt.title("Lambert")
plt.grid(True)
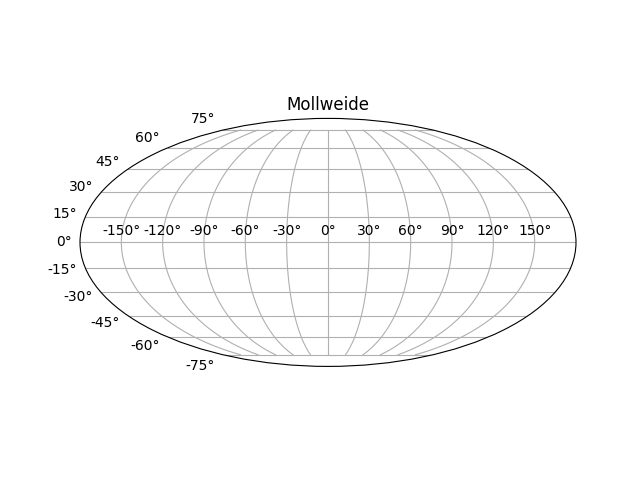
plt.figure()
plt.subplot(111, projection="mollweide")
plt.title("Mollweide")
plt.grid(True)

plt.show()
Total running time of the script: ( 0 minutes 0.032 seconds)
