import numpy as np
import matplotlib.pyplot as plt
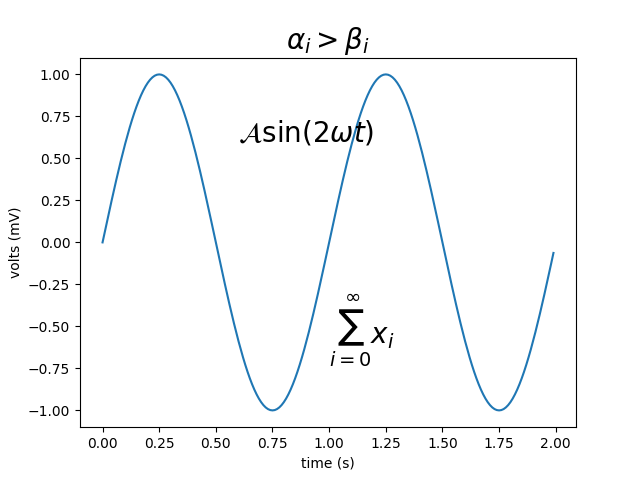
t = np.arange(0.0, 2.0, 0.01)
s = np.sin(2*np.pi*t)
plt.plot(t,s)
plt.title(r'$\alpha_i > \beta_i$', fontsize=20)
plt.text(1, -0.6, r'$\sum_{i=0}^\infty x_i$', fontsize=20)
plt.text(0.6, 0.6, r'$\mathcal{A}\mathrm{sin}(2 \omega t)$',
fontsize=20)
plt.xlabel('time (s)')
plt.ylabel('volts (mV)')
plt.show()
Total running time of the script: ( 0 minutes 0.017 seconds)
