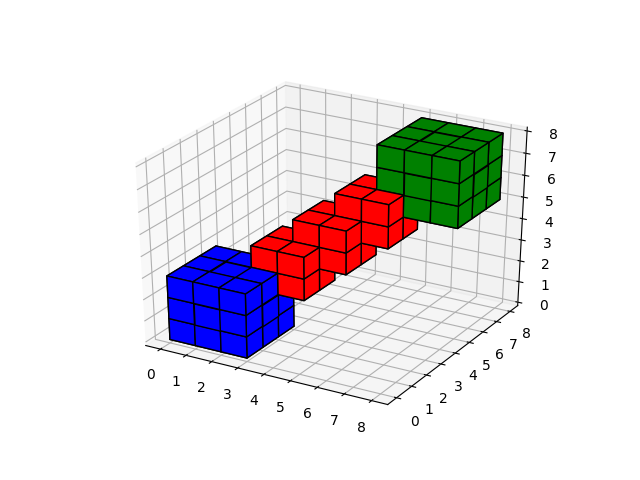
Demonstrates plotting 3D volumetric objects with ax.voxels
import matplotlib.pyplot as plt
import numpy as np
from mpl_toolkits.mplot3d import Axes3D

# prepare some coordinates
x, y, z = np.indices((8, 8, 8))

# draw cuboids in the top left and bottom right corners, and a link between them
cube1 = (x < 3) & (y < 3) & (z < 3)
cube2 = (x >= 5) & (y >= 5) & (z >= 5)
link = abs(x - y) + abs(y - z) + abs(z - x) <= 2

# combine the objects into a single boolean array
voxels = cube1 | cube2 | link

# set the colors of each object
colors = np.empty(voxels.shape, dtype=object)
colors[link] = 'red'
colors[cube1] = 'blue'
colors[cube2] = 'green'

# and plot everything
fig = plt.figure()
ax = fig.gca(projection='3d')
ax.voxels(voxels, facecolors=colors, edgecolor='k')

plt.show()
Total running time of the script: ( 0 minutes 0.031 seconds)
