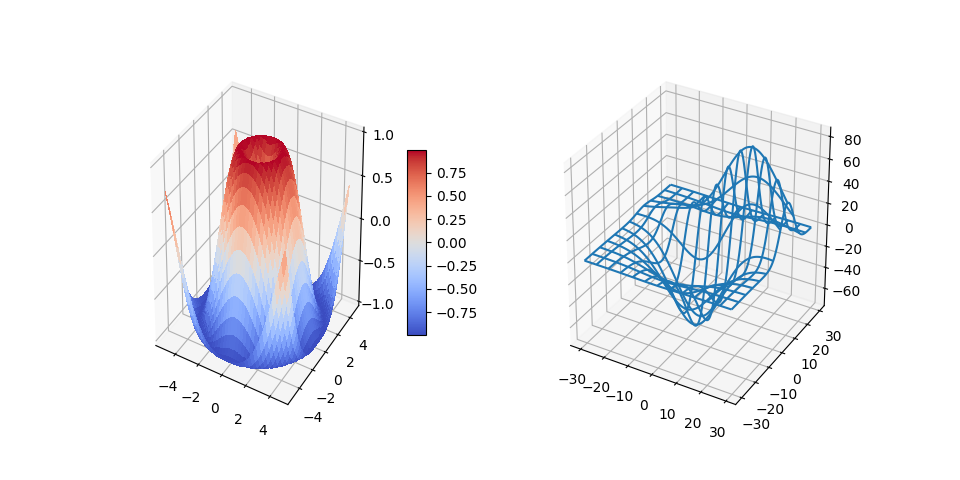
Demonstrate including 3D plots as subplots.
import matplotlib.pyplot as plt
from mpl_toolkits.mplot3d.axes3d import Axes3D, get_test_data
from matplotlib import cm
import numpy as np


# set up a figure twice as wide as it is tall
fig = plt.figure(figsize=plt.figaspect(0.5))

#===============
#  First subplot
#===============
# set up the axes for the first plot
ax = fig.add_subplot(1, 2, 1, projection='3d')

# plot a 3D surface like in the example mplot3d/surface3d_demo
X = np.arange(-5, 5, 0.25)
Y = np.arange(-5, 5, 0.25)
X, Y = np.meshgrid(X, Y)
R = np.sqrt(X**2 + Y**2)
Z = np.sin(R)
surf = ax.plot_surface(X, Y, Z, rstride=1, cstride=1, cmap=cm.coolwarm,
                       linewidth=0, antialiased=False)
ax.set_zlim(-1.01, 1.01)
fig.colorbar(surf, shrink=0.5, aspect=10)

#===============
# Second subplot
#===============
# set up the axes for the second plot
ax = fig.add_subplot(1, 2, 2, projection='3d')

# plot a 3D wireframe like in the example mplot3d/wire3d_demo
X, Y, Z = get_test_data(0.05)
ax.plot_wireframe(X, Y, Z, rstride=10, cstride=10)

plt.show()
Total running time of the script: ( 0 minutes 0.067 seconds)
