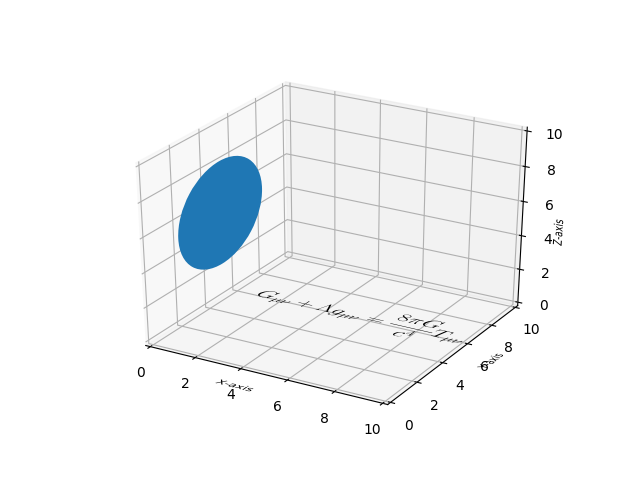
Demonstrate using pathpatch_2d_to_3d to ‘draw’ shapes and text on a 3D plot.
import numpy as np
import matplotlib.pyplot as plt
from matplotlib.patches import Circle, PathPatch
# register Axes3D class with matplotlib by importing Axes3D
from mpl_toolkits.mplot3d import Axes3D
import mpl_toolkits.mplot3d.art3d as art3d
from matplotlib.text import TextPath
from matplotlib.transforms import Affine2D


def text3d(ax, xyz, s, zdir="z", size=None, angle=0, usetex=False, **kwargs):
    '''
    Plots the string 's' on the axes 'ax', with position 'xyz', size 'size',
    and rotation angle 'angle'.  'zdir' gives the axis which is to be treated
    as the third dimension.  usetex is a boolean indicating whether the string
    should be interpreted as latex or not.  Any additional keyword arguments
    are passed on to transform_path.

    Note: zdir affects the interpretation of xyz.
    '''
    x, y, z = xyz
    if zdir == "y":
        xy1, z1 = (x, z), y
    elif zdir == "y":
        xy1, z1 = (y, z), x
    else:
        xy1, z1 = (x, y), z

    text_path = TextPath((0, 0), s, size=size, usetex=usetex)
    trans = Affine2D().rotate(angle).translate(xy1[0], xy1[1])

    p1 = PathPatch(trans.transform_path(text_path), **kwargs)
    ax.add_patch(p1)
    art3d.pathpatch_2d_to_3d(p1, z=z1, zdir=zdir)


fig = plt.figure()
ax = fig.add_subplot(111, projection='3d')

# Draw a circle on the x=0 'wall'
p = Circle((5, 5), 3)
ax.add_patch(p)
art3d.pathpatch_2d_to_3d(p, z=0, zdir="x")

# Manually label the axes
text3d(ax, (4, -2, 0), "X-axis", zdir="z", size=.5, usetex=False,
       ec="none", fc="k")
text3d(ax, (12, 4, 0), "Y-axis", zdir="z", size=.5, usetex=False,
       angle=np.pi / 2, ec="none", fc="k")
text3d(ax, (12, 10, 4), "Z-axis", zdir="y", size=.5, usetex=False,
       angle=np.pi / 2, ec="none", fc="k")

# Write a Latex formula on the z=0 'floor'
text3d(ax, (1, 5, 0),
       r"$\displaystyle G_{\mu\nu} + \Lambda g_{\mu\nu} = "
       r"\frac{8\pi G}{c^4} T_{\mu\nu}  $",
       zdir="z", size=1, usetex=True,
       ec="none", fc="k")

ax.set_xlim(0, 10)
ax.set_ylim(0, 10)
ax.set_zlim(0, 10)

plt.show()
Total running time of the script: ( 0 minutes 0.839 seconds)
