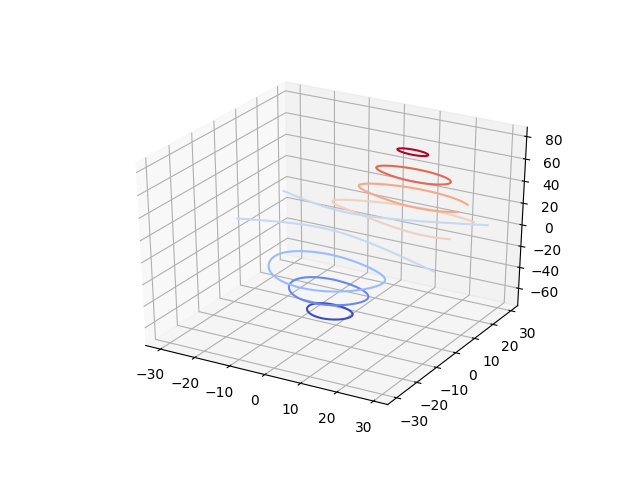
This is like a contour plot in 2D except that the f(x,y)=c curve is plotted on the plane z=c.
from mpl_toolkits.mplot3d import axes3d
import matplotlib.pyplot as plt
from matplotlib import cm

fig = plt.figure()
ax = fig.gca(projection='3d')
X, Y, Z = axes3d.get_test_data(0.05)

# Plot contour curves
cset = ax.contour(X, Y, Z, cmap=cm.coolwarm)

ax.clabel(cset, fontsize=9, inline=1)

plt.show()
Total running time of the script: ( 0 minutes 0.021 seconds)
