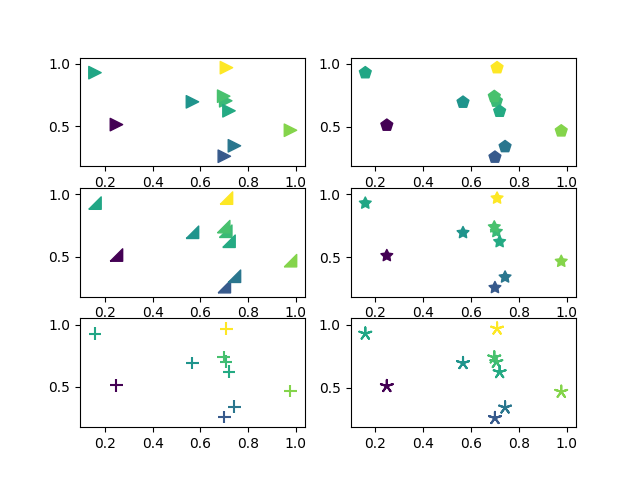
import numpy as np
import matplotlib.pyplot as plt

# Fixing random state for reproducibility
np.random.seed(19680801)


x = np.random.rand(10)
y = np.random.rand(10)
z = np.sqrt(x**2 + y**2)

plt.subplot(321)
plt.scatter(x, y, s=80, c=z, marker=">")

plt.subplot(322)
plt.scatter(x, y, s=80, c=z, marker=(5, 0))

verts = list(zip([-1., 1., 1., -1.], [-1., -1., 1., -1.]))
plt.subplot(323)
plt.scatter(x, y, s=80, c=z, marker=(verts, 0))
# equivalent:
# plt.scatter(x, y, s=80, c=z, marker=None, verts=verts)

plt.subplot(324)
plt.scatter(x, y, s=80, c=z, marker=(5, 1))

plt.subplot(325)
plt.scatter(x, y, s=80, c=z, marker='+')

plt.subplot(326)
plt.scatter(x, y, s=80, c=z, marker=(5, 2))

plt.show()
Total running time of the script: ( 0 minutes 0.168 seconds)
