The documentation for Matplotlib is generated from reStructuredText using
the Sphinx documentation generation tool. There are several extra requirements
that are needed to build the documentation. They are listed in
doc-requirements.txt and listed below:
Note
All documentation is built from the doc/ directory. This directory
contains both .rst files that contain pages in the documentation and
configuration files for Sphinx.
The .rst files are kept in doc/users,
doc/devel, doc/api and doc/faq. The main entry point is
doc/index.rst, which pulls in the index.rst file for the users
guide, developers guide, api reference, and FAQs. The documentation suite is
built as a single document in order to make the most effective use of cross
referencing.
Note
An exception to this are the directories examples and
tutorials, which exist in the root directory. These contain Python
files that are built by Sphinx Gallery. When the docs are built,
the directories docs/gallery and docs/tutorials
are automatically generated. Do not edit the rst files in :file:docs/gallery
and :file:docs/tutorials, as they are rebuilt from the original sources in
the root directory.
Additional files can be added to the various guides by including their base file name (the .rst extension is not necessary) in the table of contents. It is also possible to include other documents through the use of an include statement, such as:
.. include:: ../../TODO
The configuration file for Sphinx is doc/conf.py. It controls which
directories Sphinx parses, how the docs are built, and how the extensions are
used.
The documentation sources are found in the doc/ directory in the trunk.
To build the documentation in html format, cd into doc/ and run:
python make.py html
The list of commands and flags for make.py can be listed by running
python make.py --help. In particular,
python make.py clean will delete the built Sphinx files. Use this command
if you’re getting strange errors about missing paths or broken links,
particularly if you move files around.python make.py latex builds a PDF of the documentation.--allowsphinxwarnings flag allows the docs to continue building even
if Sphinx throws a warning. This is useful for debugging and spot-checking
many warnings at once.Most documentation lives in “docstrings”. These are comment blocks in source code that explain how the code works. All new or edited docstrings should conform to the numpydoc guidelines. These split the docstring into a number of sections - see https://github.com/numpy/numpy/blob/master/doc/HOWTO_DOCUMENT.rst.txt for more details and a guide to how docstrings should be formatted.
An example docstring looks like:
def hlines(self, y, xmin, xmax, colors='k', linestyles='solid',
           label='', **kwargs):
      """
      Plot horizontal lines at each *y* from *xmin* to *xmax*.

      Parameters
      ----------
      y : scalar or sequence of scalar
          y-indexes where to plot the lines.

      xmin, xmax : scalar or 1D array_like
          Respective beginning and end of each line. If scalars are
          provided, all lines will have same length.

      colors : array_like of colors, optional, default: 'k'

      linestyles : ['solid' | 'dashed' | 'dashdot' | 'dotted'], optional

      label : string, optional, default: ''

      Returns
      -------
      lines : `~matplotlib.collections.LineCollection`

      Other Parameters
      ----------------
      **kwargs : `~matplotlib.collections.LineCollection` properties.

      See also
      --------
      vlines : vertical lines
      axhline: horizontal line across the axes
      """
The Sphinx website also contains plenty of documentation concerning ReST markup and working with Sphinx in general.
Note
Some parts of the documentation do not yet conform to the current documentation style. If in doubt, follow the rules given here and not what you may see in the source code. Pull requests updating docstrings to the current style are very welcome.
There are some additional conventions, not handled by numpydoc and the Sphinx guide:
We do not have a convention whether to use single-quotes or double-quotes. There is a mixture of both in the current code. Please leave them as they are.
Long parameter lists should be wrapped using a \ for continuation and
starting on the new line without any indent:
def add_axes(self, *args, **kwargs):
    """
    ...

    Parameters
    ----------
    projection :
        ['aitoff' | 'hammer' | 'lambert' | 'mollweide' | \
'polar' | 'rectilinear'], optional
        The projection type of the axes.
Alternatively, you can describe the valid parameter values in a dedicated section of the docstring.
Generally, do not add markup to types for Parameters and Returns.
This is usually not needed because Sphinx will link them automatically and
would unnecessarily clutter the docstring. However, it does seem to fail in
some situations. If you encounter such a case, you are allowed to add markup:
Returns
-------
lines : `~matplotlib.collections.LineCollection`
To link to other methods, classes, or modules in Matplotlib you can encase the name to refer to in back ticks, for example:
`~matplotlib.collections.LineCollection`
It is also possible to add links to code in Python, Numpy, Scipy, or Pandas. Sometimes it is tricky to get external Sphinx linking to work; to check that a something exists to link to the following shell command outputs a list of all objects that can be referenced (in this case for Numpy):
python -m sphinx.ext.intersphinx 'https://docs.scipy.org/doc/numpy/objects.inv'
Function arguments and keywords within docstrings should be referred to using
the *emphasis* role. This will keep Matplotlib’s documentation consistent
with Python’s documentation:
Here is a description of *argument*
Please do not use the `default role`:
Please do not describe `argument` like this.
nor the ``literal`` role:
Please do not describe ``argument`` like this.
Matplotlib uses artist introspection of docstrings to support properties.
All properties that you want to support through setp and
getp should have a set_property and get_property method in
the Artist class. The setter methods use the docstring
with the ACCEPTS token to indicate the type of argument the method accepts.
e.g., in Line2D:
# in lines.py
def set_linestyle(self, linestyle):
    """
    Set the linestyle of the line

    ACCEPTS: [ '-' | '--' | '-.' | ':' | 'steps' | 'None' | ' ' | '' ]
    """
Since Matplotlib uses a lot of pass-through kwargs, e.g., in every function
that creates a line (plot, semilogx, semilogy,
etc…), it can be difficult for the new user to know which kwargs are
supported. Matplotlib uses a docstring interpolation scheme to support
documentation of every function that takes a **kwargs. The requirements
are:
The function matplotlib.artist.kwdoc and the decorator
matplotlib.docstring.dedent_interpd facilitate this. They combine Python
string interpolation in the docstring with the Matplotlib artist introspection
facility that underlies setp and getp. The kwdoc function gives
the list of properties as a docstring. In order to use this in another
docstring, first update the matplotlib.docstring.interpd object, as seen in
this example from matplotlib.lines:
# in lines.py
docstring.interpd.update(Line2D=artist.kwdoc(Line2D))
Then in any function accepting Line2D pass-through kwargs, e.g.,
matplotlib.axes.Axes.plot:
# in axes.py
@docstring.dedent_interpd
def plot(self, *args, **kwargs):
    """
    Some stuff omitted

    The kwargs are Line2D properties:
    %(Line2D)s

    kwargs scalex and scaley, if defined, are passed on
    to autoscale_view to determine whether the x and y axes are
    autoscaled; default True.  See Axes.autoscale_view for more
    information
    """
Note there is a problem for Artist __init__ methods,
e.g., matplotlib.patches.Patch.__init__, which supports Patch kwargs,
since the artist inspector cannot work until the class is fully defined and
we can’t modify the Patch.__init__.__doc__ docstring outside the class
definition. There are some some manual hacks in this case, violating the
“single entry point” requirement above – see the docstring.interpd.update
calls in matplotlib.patches.
Figures in the documentation are automatically generated from scripts. It is not necessary to explicitly save the figure from the script; this will be done automatically when the docs are built to ensure that the code that is included runs and produces the advertised figure.
There are two options for where to put the code that generates a figure. If
you want to include a plot in the examples gallery, the code should be added to
the examples directory. Plots from
the examples directory can then be referenced through the symlink
mpl_examples in the doc directory, e.g.:
.. plot:: mpl_examples/lines_bars_and_markers/fill.py
Alternatively the plotting code can be placed directly in the docstring. To include plots directly in docstrings, see the following guide:
A directive for including a matplotlib plot in a Sphinx document.
By default, in HTML output, plot will include a .png file with a
link to a high-res .png and .pdf. In LaTeX output, it will include a
.pdf.
The source code for the plot may be included in one of three ways:
A path to a source file as the argument to the directive:
.. plot:: path/to/plot.pyWhen a path to a source file is given, the content of the directive may optionally contain a caption for the plot:
.. plot:: path/to/plot.py

   This is the caption for the plot
Additionally, one may specify the name of a function to call (with no arguments) immediately after importing the module:
.. plot:: path/to/plot.py plot_function1Included as inline content to the directive:
.. plot::

   import matplotlib.pyplot as plt
   import matplotlib.image as mpimg
   import numpy as np
   img = mpimg.imread('_static/stinkbug.png')
   imgplot = plt.imshow(img)
Using doctest syntax:
.. plot::
   A plotting example:
   >>> import matplotlib.pyplot as plt
   >>> plt.plot([1,2,3], [4,5,6])
The plot directive supports the following options:
- format : {‘python’, ‘doctest’}
- Specify the format of the input
- include-source : bool
- Whether to display the source code. The default can be changed using the
plot_include_sourcevariable in conf.py- encoding : str
- If this source file is in a non-UTF8 or non-ASCII encoding, the encoding must be specified using the
:encoding:option. The encoding will not be inferred using the-*- coding -*-metacomment.- context : bool or str
- If provided, the code will be run in the context of all previous plot directives for which the
:context:option was specified. This only applies to inline code plot directives, not those run from files. If the:context: resetoption is specified, the context is reset for this and future plots, and previous figures are closed prior to running the code.:context:close-figskeeps the context but closes previous figures before running the code.- nofigs : bool
- If specified, the code block will be run, but no figures will be inserted. This is usually useful with the
:context:option.
Additionally, this directive supports all of the options of the
image directive, except for target (since plot will add its own
target). These include alt, height, width, scale, align and
class.
The plot directive has the following configuration options:
- plot_include_source
- Default value for the include-source option
- plot_html_show_source_link
- Whether to show a link to the source in HTML.
- plot_pre_code
Code that should be executed before each plot. If not specified or None it will default to a string containing:
import numpy as np from matplotlib import pyplot as plt- plot_basedir
- Base directory, to which
plot::file names are relative to. (If None or empty, file names are relative to the directory where the file containing the directive is.)- plot_formats
File formats to generate. List of tuples or strings:
[(suffix, dpi), suffix, ...]that determine the file format and the DPI. For entries whose DPI was omitted, sensible defaults are chosen. When passing from the command line through sphinx_build the list should be passed as suffix:dpi,suffix:dpi, ….
- plot_html_show_formats
- Whether to show links to the files in HTML.
- plot_rcparams
- A dictionary containing any non-standard rcParams that should be applied before each plot.
- plot_apply_rcparams
- By default, rcParams are applied when
contextoption is not used in a plot directive. This configuration option overrides this behavior and applies rcParams before each plot.- plot_working_directory
- By default, the working directory will be changed to the directory of the example, so the code can get at its data files, if any. Also its path will be added to
sys.pathso it can import any helper modules sitting beside it. This configuration option can be used to specify a central directory (also added tosys.path) where data files and helper modules for all code are located.- plot_template
- Provide a customized template for preparing restructured text.
matplotlib.sphinxext.plot_directive.mark_plot_labels(app, document)¶To make plots referenceable, we need to move the reference from the “htmlonly” (or “latexonly”) node to the actual figure node itself.
matplotlib.sphinxext.plot_directive.out_of_date(original, derived)¶Returns True if derivative is out-of-date wrt original, both of which are full file paths.
matplotlib.sphinxext.plot_directive.plot_directive(name, arguments, options, content, lineno, content_offset, block_text, state, state_machine)¶A directive for including a matplotlib plot in a Sphinx document.
By default, in HTML output, plot will include a .png file with a
link to a high-res .png and .pdf. In LaTeX output, it will include a
.pdf.
The source code for the plot may be included in one of three ways:
A path to a source file as the argument to the directive:
.. plot:: path/to/plot.pyWhen a path to a source file is given, the content of the directive may optionally contain a caption for the plot:
.. plot:: path/to/plot.py

   This is the caption for the plot
Additionally, one may specify the name of a function to call (with no arguments) immediately after importing the module:
.. plot:: path/to/plot.py plot_function1Included as inline content to the directive:
.. plot::

   import matplotlib.pyplot as plt
   import matplotlib.image as mpimg
   import numpy as np
   img = mpimg.imread('_static/stinkbug.png')
   imgplot = plt.imshow(img)
Using doctest syntax:
.. plot::
   A plotting example:
   >>> import matplotlib.pyplot as plt
   >>> plt.plot([1,2,3], [4,5,6])
matplotlib.sphinxext.plot_directive.remove_coding(text)¶Remove the coding comment, which six.exec_ doesn’t like.
matplotlib.sphinxext.plot_directive.render_figures(code, code_path, output_dir, output_base, context, function_name, config, context_reset=False, close_figs=False)¶Run a pyplot script and save the images in output_dir.
Save the images under output_dir with file names derived from output_base
matplotlib.sphinxext.plot_directive.run_code(code, code_path, ns=None, function_name=None)¶Import a Python module from a path, and run the function given by name, if function_name is not None.
matplotlib.sphinxext.plot_directive.split_code_at_show(text)¶Split code at plt.show()
matplotlib.sphinxext.plot_directive.unescape_doctest(text)¶Extract code from a piece of text, which contains either Python code or doctests.
The source of the files in the examples directory are automatically run
and their output plots included in the documentation. To exclude an example
from having an plot generated insert “sgskip” somewhere in the filename.
We have a Matplotlib Google/Gmail account with username mplgithub
which we used to setup the github account but can be used for other
purposes, like hosting Google docs or Youtube videos. You can embed a
Matplotlib animation in the docs by first saving the animation as a
movie using matplotlib.animation.Animation.save(), and then
uploading to matplotlib’s Youtube
channel and inserting the
embedding string youtube provides like:
.. raw:: html

   <iframe width="420" height="315"
     src="http://www.youtube.com/embed/32cjc6V0OZY"
     frameborder="0" allowfullscreen>
   </iframe>
An example save command to generate a movie looks like this
ani = animation.FuncAnimation(fig, animate, np.arange(1, len(y)),
    interval=25, blit=True, init_func=init)

ani.save('double_pendulum.mp4', fps=15)
Contact Michael Droettboom for the login password to upload youtube videos of google docs to the mplgithub account.
In the documentation, you may want to include to a data file in the Matplotlib
sources, e.g., a license file or an image file from mpl-data, refer to it via
a relative path from the document where the rst file resides, e.g.,
in users/navigation_toolbar.rst, you can refer to the image icons with:
.. image:: ../../lib/matplotlib/mpl-data/images/subplots.png
In the users subdirectory, if you want to refer to a file in the
mpl-data directory, you can use the symlink directory. For example,
from customizing.rst:
.. literalinclude:: ../../lib/matplotlib/mpl-data/matplotlibrc
One exception to this is when referring to the examples directory. Relative
paths are extremely confusing in the sphinx plot extensions, so it is easier
to simply include a symlink to the files at the top doc level directory.
This way, API documents like matplotlib.pyplot.plot() can refer to the
examples in a known location.
In the top level doc directory we have symlinks pointing to the
Matplotlib examples:
home:~/mpl/doc> ls -l mpl_*
mpl_examples -> ../examples
So we can include plots from the examples dir using the symlink:
.. plot:: mpl_examples/pylab_examples/simple_plot.py
To maximize internal consistency in section labeling and references, use hyphen separated, descriptive labels for section references, e.g.:
.. _howto-webapp:
and refer to it using the standard reference syntax:
See :ref:`howto-webapp`
Keep in mind that we may want to reorganize the contents later, so
please try to avoid top level names in references like user or devel
or faq unless necessary, because for example the FAQ “what is a
backend?” could later become part of the users guide, so the label:
.. _what-is-a-backend
is better than:
.. _faq-backend
In addition, since underscores are widely used by Sphinx itself, please use hyphens to separate words.
For everything but top level chapters, please use Upper lower for
section titles, e.g., Possible hangups rather than Possible
Hangups
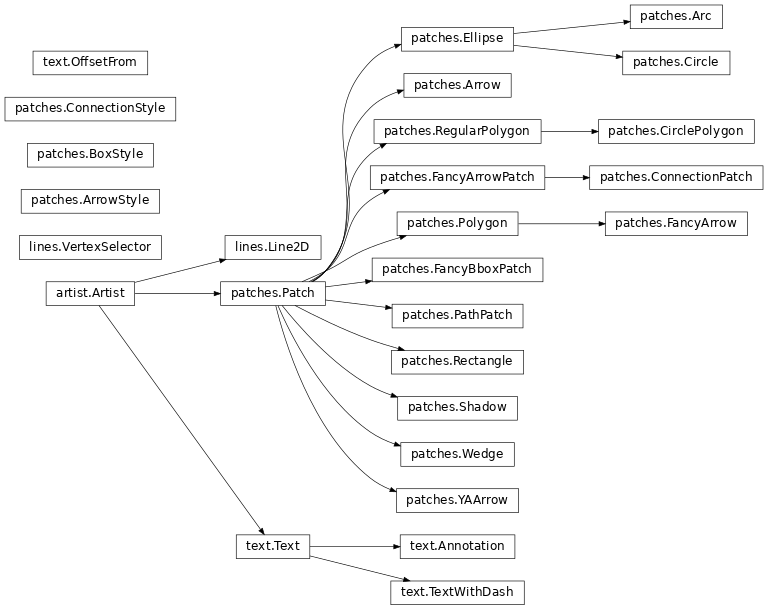
Class inheritance diagrams can be generated with the
inheritance-diagram directive. To use it, provide the
directive with a number of class or module names (separated by
whitespace). If a module name is provided, all classes in that module
will be used. All of the ancestors of these classes will be included
in the inheritance diagram.
A single option is available: parts controls how many of parts in
the path to the class are shown. For example, if parts == 1, the
class matplotlib.patches.Patch is shown as Patch. If parts
== 2, it is shown as patches.Patch. If parts == 0, the full
path is shown.
Example:
.. inheritance-diagram:: matplotlib.patches matplotlib.lines matplotlib.text
   :parts: 2
There is an emacs mode rst.el which
automates many important ReST tasks like building and updating
table-of-contents, and promoting or demoting section headings. Here
is the basic .emacs configuration:
(require 'rst)
(setq auto-mode-alist
      (append '(("\\.txt$" . rst-mode)
                ("\\.rst$" . rst-mode)
                ("\\.rest$" . rst-mode)) auto-mode-alist))
Some helpful functions:
C-c TAB - rst-toc-insert

  Insert table of contents at point

C-c C-u - rst-toc-update

    Update the table of contents at point

C-c C-l rst-shift-region-left

    Shift region to the left

C-c C-r rst-shift-region-right

    Shift region to the right
