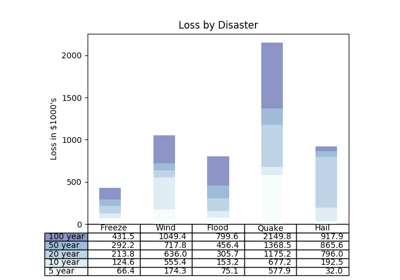
matplotlib.pyplot.table(**kwargs)¶Add a table to the current axes.
Call signature:
table(cellText=None, cellColours=None,
      cellLoc='right', colWidths=None,
      rowLabels=None, rowColours=None, rowLoc='left',
      colLabels=None, colColours=None, colLoc='center',
      loc='bottom', bbox=None):
Returns a matplotlib.table.Table instance. Either cellText
or cellColours must be provided. For finer grained control over
tables, use the Table class and add it to
the axes with add_table().
Thanks to John Gill for providing the class and table.
kwargs control the Table
properties:
Property Description agg_filtera filter function, which takes a (m, n, 3) float array and a dpi value, and returns a (m, n, 3) array alphafloat (0.0 transparent through 1.0 opaque) animatedbool clip_boxa Bboxinstanceclip_onbool clip_path[( Path,Transform) |Patch| None]containsa callable function figurea Figureinstancefontsizea float in points gidan id string labelobject path_effectsAbstractPathEffectpicker[None | bool | float | callable] rasterizedbool or None sketch_params(scale: float, length: float, randomness: float) snapbool or None transformTransformurla url string visiblebool zorderfloat