You are reading an old version of the documentation (v2.1.1). For the latest version see https://matplotlib.org/stable/api/_as_gen/matplotlib.pyplot.plot_date.html
matplotlib
Fork me on GitHub


Travis-CI:

Table Of Contents

This Page

matplotlib.pyplot.plot_date

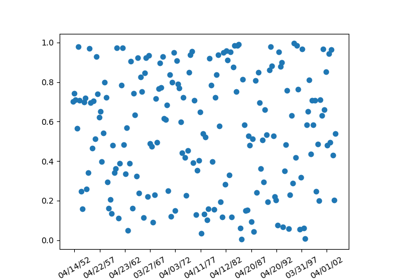
matplotlib.pyplot.plot_date(x, y, fmt='o', tz=None, xdate=True, ydate=False, hold=None, data=None, **kwargs)

A plot with data that contains dates.

Similar to the plot() command, except the x or y (or both) data is considered to be dates, and the axis is labeled accordingly.

x and/or y can be a sequence of dates represented as float days since 0001-01-01 UTC.

Note if you are using custom date tickers and formatters, it may be necessary to set the formatters/locators after the call to plot_date() since plot_date() will set the default tick locator to matplotlib.dates.AutoDateLocator (if the tick locator is not already set to a matplotlib.dates.DateLocator instance) and the default tick formatter to matplotlib.dates.AutoDateFormatter (if the tick formatter is not already set to a matplotlib.dates.DateFormatter instance).

Parameters:

fmt : string

The plot format string.

tz : [ None | timezone string | tzinfo instance]

The time zone to use in labeling dates. If None, defaults to rc value.

xdate : boolean

If True, the x-axis will be labeled with dates.

ydate : boolean

If True, the y-axis will be labeled with dates.

Returns:

lines

Other Parameters:
 

**kwargs :

Keyword arguments control the Line2D properties:

Property Description
agg_filter a filter function, which takes a (m, n, 3) float array and a dpi value, and returns a (m, n, 3) array
alpha float (0.0 transparent through 1.0 opaque)
animated bool
antialiased or aa [True | False]
clip_box a Bbox instance
clip_on bool
clip_path [(Path, Transform) | Patch | None]
color or c any matplotlib color
contains a callable function
dash_capstyle [‘butt’ | ‘round’ | ‘projecting’]
dash_joinstyle [‘miter’ | ‘round’ | ‘bevel’]
dashes sequence of on/off ink in points
drawstyle [‘default’ | ‘steps’ | ‘steps-pre’ | ‘steps-mid’ | ‘steps-post’]
figure a Figure instance
fillstyle [‘full’ | ‘left’ | ‘right’ | ‘bottom’ | ‘top’ | ‘none’]
gid an id string
label object
linestyle or ls [‘solid’ | ‘dashed’, ‘dashdot’, ‘dotted’ | (offset, on-off-dash-seq) | '-' | '--' | '-.' | ':' | 'None' | ' ' | '']
linewidth or lw float value in points
marker A valid marker style
markeredgecolor or mec any matplotlib color
markeredgewidth or mew float value in points
markerfacecolor or mfc any matplotlib color
markerfacecoloralt or mfcalt any matplotlib color
markersize or ms float
markevery [None | int | length-2 tuple of int | slice | list/array of int | float | length-2 tuple of float]
path_effects AbstractPathEffect
picker float distance in points or callable pick function fn(artist, event)
pickradius float distance in points
rasterized bool or None
sketch_params (scale: float, length: float, randomness: float)
snap bool or None
solid_capstyle [‘butt’ | ‘round’ | ‘projecting’]
solid_joinstyle [‘miter’ | ‘round’ | ‘bevel’]
transform a matplotlib.transforms.Transform instance
url a url string
visible bool
xdata 1D array
ydata 1D array
zorder float

.. note::

In addition to the above described arguments, this function can take a data keyword argument. If such a data argument is given, the following arguments are replaced by data[<arg>]:

  • All arguments with the following names: ‘x’, ‘y’.

See also

matplotlib.dates
helper functions on dates
matplotlib.dates.date2num
how to convert dates to num
matplotlib.dates.num2date
how to convert num to dates
matplotlib.dates.drange
how floating point dates

Examples using matplotlib.pyplot.plot_date