import numpy as np
import matplotlib.pyplot as plt
from matplotlib.widgets import MultiCursor
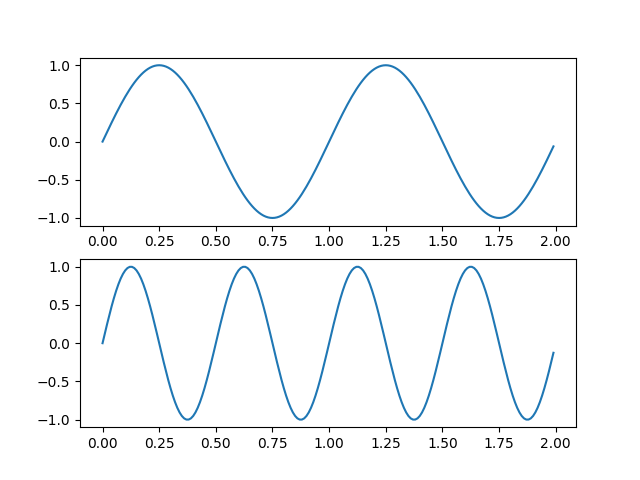
t = np.arange(0.0, 2.0, 0.01)
s1 = np.sin(2*np.pi*t)
s2 = np.sin(4*np.pi*t)
fig = plt.figure()
ax1 = fig.add_subplot(211)
ax1.plot(t, s1)
ax2 = fig.add_subplot(212, sharex=ax1)
ax2.plot(t, s2)
multi = MultiCursor(fig.canvas, (ax1, ax2), color='r', lw=1)
plt.show()
Total running time of the script: ( 0 minutes 0.036 seconds)
