import matplotlib.pyplot as plt
fig, ax = plt.subplots()
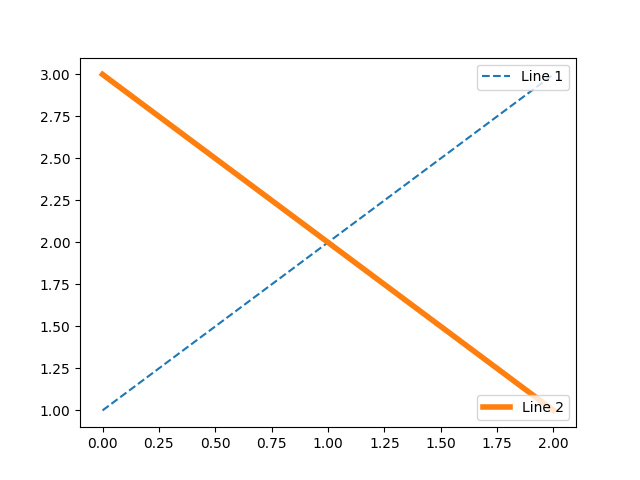
line1, = ax.plot([1, 2, 3], label="Line 1", linestyle='--')
line2, = ax.plot([3, 2, 1], label="Line 2", linewidth=4)
# Create a legend for the first line.
first_legend = ax.legend(handles=[line1], loc=1)
# Add the legend manually to the current Axes.
ax.add_artist(first_legend)
# Create another legend for the second line.
ax.legend(handles=[line2], loc=4)
plt.show()
Total running time of the script: ( 0 minutes 0.020 seconds)
