import matplotlib.pyplot as plt
from matplotlib.gridspec import GridSpec
def make_ticklabels_invisible(fig):
for i, ax in enumerate(fig.axes):
ax.text(0.5, 0.5, "ax%d" % (i+1), va="center", ha="center")
ax.tick_params(labelbottom=False, labelleft=False)
fig = plt.figure()
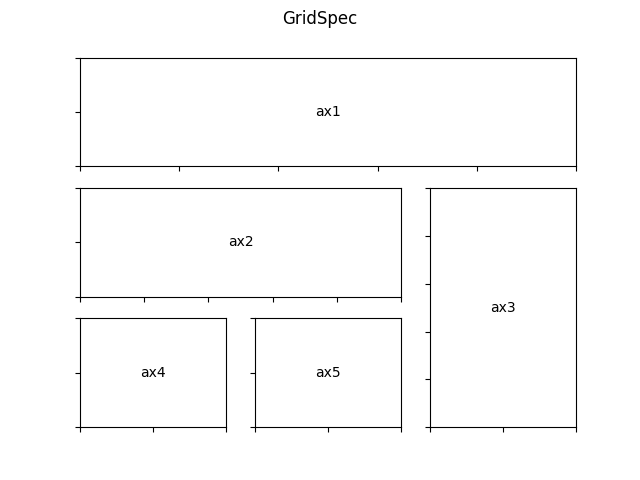
gs = GridSpec(3, 3)
ax1 = plt.subplot(gs[0, :])
# identical to ax1 = plt.subplot(gs.new_subplotspec((0, 0), colspan=3))
ax2 = plt.subplot(gs[1, :-1])
ax3 = plt.subplot(gs[1:, -1])
ax4 = plt.subplot(gs[-1, 0])
ax5 = plt.subplot(gs[-1, -2])
fig.suptitle("GridSpec")
make_ticklabels_invisible(fig)
plt.show()
Total running time of the script: ( 0 minutes 0.167 seconds)
