import matplotlib.pyplot as plt
import matplotlib.patches as mpatches
from mpl_toolkits.axes_grid1.axes_grid import AxesGrid
from matplotlib.offsetbox import AnchoredText
x1, y1 = 0.3, 0.3
x2, y2 = 0.7, 0.7
fig = plt.figure(1, figsize=(8, 3))
fig.clf()
def add_at(ax, t, loc=2):
fp = dict(size=10)
_at = AnchoredText(t, loc=loc, prop=fp)
ax.add_artist(_at)
return _at
grid = AxesGrid(fig, 111, (1, 4), label_mode="1", share_all=True)
grid[0].set_autoscale_on(False)
ax = grid[0]
ax.plot([x1, x2], [y1, y2], ".")
el = mpatches.Ellipse((x1, y1), 0.3, 0.4, angle=30, alpha=0.2)
ax.add_artist(el)
ax.annotate("",
xy=(x1, y1), xycoords='data',
xytext=(x2, y2), textcoords='data',
arrowprops=dict(arrowstyle="-",
color="0.5",
patchB=None,
shrinkB=0,
connectionstyle="arc3,rad=0.3",
),
)
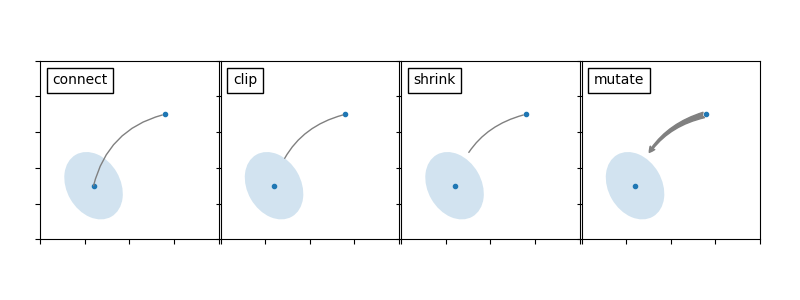
add_at(ax, "connect", loc=2)
ax = grid[1]
ax.plot([x1, x2], [y1, y2], ".")
el = mpatches.Ellipse((x1, y1), 0.3, 0.4, angle=30, alpha=0.2)
ax.add_artist(el)
ax.annotate("",
xy=(x1, y1), xycoords='data',
xytext=(x2, y2), textcoords='data',
arrowprops=dict(arrowstyle="-",
color="0.5",
patchB=el,
shrinkB=0,
connectionstyle="arc3,rad=0.3",
),
)
add_at(ax, "clip", loc=2)
ax = grid[2]
ax.plot([x1, x2], [y1, y2], ".")
el = mpatches.Ellipse((x1, y1), 0.3, 0.4, angle=30, alpha=0.2)
ax.add_artist(el)
ax.annotate("",
xy=(x1, y1), xycoords='data',
xytext=(x2, y2), textcoords='data',
arrowprops=dict(arrowstyle="-",
color="0.5",
patchB=el,
shrinkB=5,
connectionstyle="arc3,rad=0.3",
),
)
add_at(ax, "shrink", loc=2)
ax = grid[3]
ax.plot([x1, x2], [y1, y2], ".")
el = mpatches.Ellipse((x1, y1), 0.3, 0.4, angle=30, alpha=0.2)
ax.add_artist(el)
ax.annotate("",
xy=(x1, y1), xycoords='data',
xytext=(x2, y2), textcoords='data',
arrowprops=dict(arrowstyle="fancy",
color="0.5",
patchB=el,
shrinkB=5,
connectionstyle="arc3,rad=0.3",
),
)
add_at(ax, "mutate", loc=2)
grid[0].set_xlim(0, 1)
grid[0].set_ylim(0, 1)
grid[0].axis["bottom"].toggle(ticklabels=False)
grid[0].axis["left"].toggle(ticklabels=False)
fig.subplots_adjust(left=0.05, right=0.95, bottom=0.05, top=0.95)
plt.show()
Total running time of the script: ( 0 minutes 0.132 seconds)
