The example shows use of ScalarFormatter with different settings.
Example 1 : Default
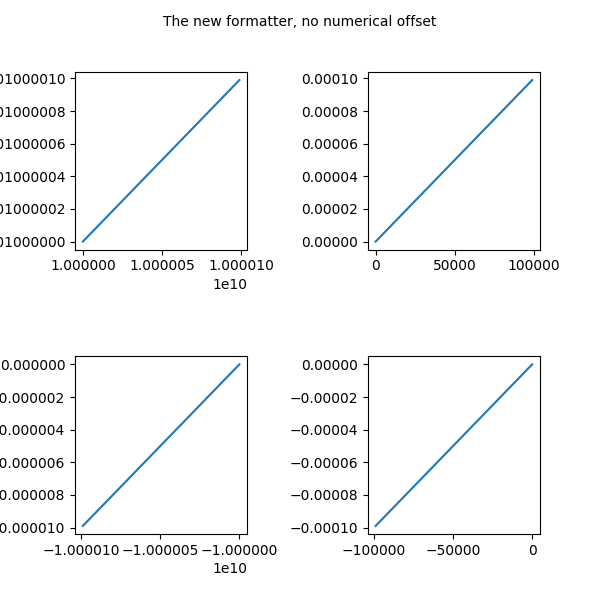
Example 2 : With no Numerical Offset
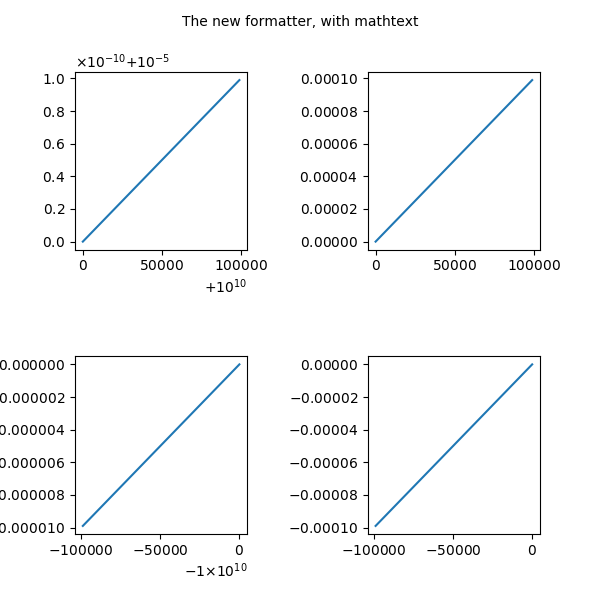
Example 3 : With Mathtext
import matplotlib.pyplot as plt
import numpy as np
from matplotlib.ticker import ScalarFormatter
Example 1
x = np.arange(0, 1, .01)
fig, [[ax1, ax2], [ax3, ax4]] = plt.subplots(2, 2, figsize=(6, 6))
fig.text(0.5, 0.975, 'The new formatter, default settings',
         horizontalalignment='center',
         verticalalignment='top')

ax1.plot(x * 1e5 + 1e10, x * 1e-10 + 1e-5)
ax1.xaxis.set_major_formatter(ScalarFormatter())
ax1.yaxis.set_major_formatter(ScalarFormatter())

ax2.plot(x * 1e5, x * 1e-4)
ax2.xaxis.set_major_formatter(ScalarFormatter())
ax2.yaxis.set_major_formatter(ScalarFormatter())

ax3.plot(-x * 1e5 - 1e10, -x * 1e-5 - 1e-10)
ax3.xaxis.set_major_formatter(ScalarFormatter())
ax3.yaxis.set_major_formatter(ScalarFormatter())

ax4.plot(-x * 1e5, -x * 1e-4)
ax4.xaxis.set_major_formatter(ScalarFormatter())
ax4.yaxis.set_major_formatter(ScalarFormatter())

fig.subplots_adjust(wspace=0.7, hspace=0.6)

Example 2
x = np.arange(0, 1, .01)
fig, [[ax1, ax2], [ax3, ax4]] = plt.subplots(2, 2, figsize=(6, 6))
fig.text(0.5, 0.975, 'The new formatter, no numerical offset',
         horizontalalignment='center',
         verticalalignment='top')

ax1.plot(x * 1e5 + 1e10, x * 1e-10 + 1e-5)
ax1.xaxis.set_major_formatter(ScalarFormatter(useOffset=False))
ax1.yaxis.set_major_formatter(ScalarFormatter(useOffset=False))

ax2.plot(x * 1e5, x * 1e-4)
ax2.xaxis.set_major_formatter(ScalarFormatter(useOffset=False))
ax2.yaxis.set_major_formatter(ScalarFormatter(useOffset=False))

ax3.plot(-x * 1e5 - 1e10, -x * 1e-5 - 1e-10)
ax3.xaxis.set_major_formatter(ScalarFormatter(useOffset=False))
ax3.yaxis.set_major_formatter(ScalarFormatter(useOffset=False))

ax4.plot(-x * 1e5, -x * 1e-4)
ax4.xaxis.set_major_formatter(ScalarFormatter(useOffset=False))
ax4.yaxis.set_major_formatter(ScalarFormatter(useOffset=False))

fig.subplots_adjust(wspace=0.7, hspace=0.6)
Example 3
x = np.arange(0, 1, .01)
fig, [[ax1, ax2], [ax3, ax4]] = plt.subplots(2, 2, figsize=(6, 6))
fig.text(0.5, 0.975, 'The new formatter, with mathtext',
         horizontalalignment='center',
         verticalalignment='top')

ax1.plot(x * 1e5 + 1e10, x * 1e-10 + 1e-5)
ax1.xaxis.set_major_formatter(ScalarFormatter(useMathText=True))
ax1.yaxis.set_major_formatter(ScalarFormatter(useMathText=True))

ax2.plot(x * 1e5, x * 1e-4)
ax2.xaxis.set_major_formatter(ScalarFormatter(useMathText=True))
ax2.yaxis.set_major_formatter(ScalarFormatter(useMathText=True))

ax3.plot(-x * 1e5 - 1e10, -x * 1e-5 - 1e-10)
ax3.xaxis.set_major_formatter(ScalarFormatter(useMathText=True))
ax3.yaxis.set_major_formatter(ScalarFormatter(useMathText=True))

ax4.plot(-x * 1e5, -x * 1e-4)
ax4.xaxis.set_major_formatter(ScalarFormatter(useMathText=True))
ax4.yaxis.set_major_formatter(ScalarFormatter(useMathText=True))

fig.subplots_adjust(wspace=0.7, hspace=0.6)

plt.show()
Total running time of the script: ( 0 minutes 0.207 seconds)
