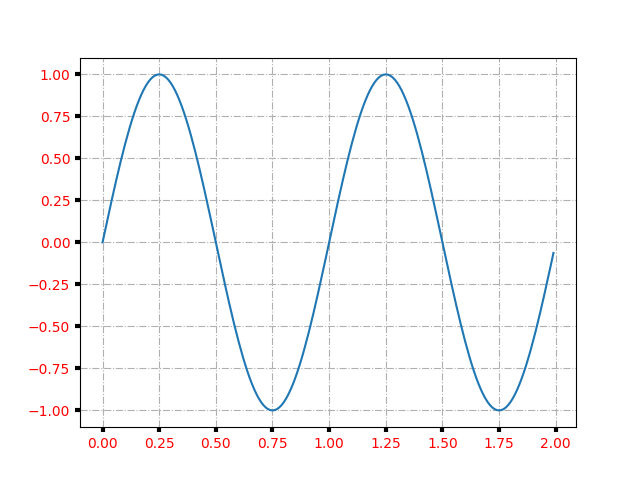
You can control the axis tick and grid properties
import matplotlib.pyplot as plt
import numpy as np

t = np.arange(0.0, 2.0, 0.01)
s = np.sin(2 * np.pi * t)

fig, ax = plt.subplots()
ax.plot(t, s)

ax.grid(True, linestyle='-.')
ax.tick_params(labelcolor='r', labelsize='medium', width=3)

plt.show()
Total running time of the script: ( 0 minutes 0.021 seconds)
