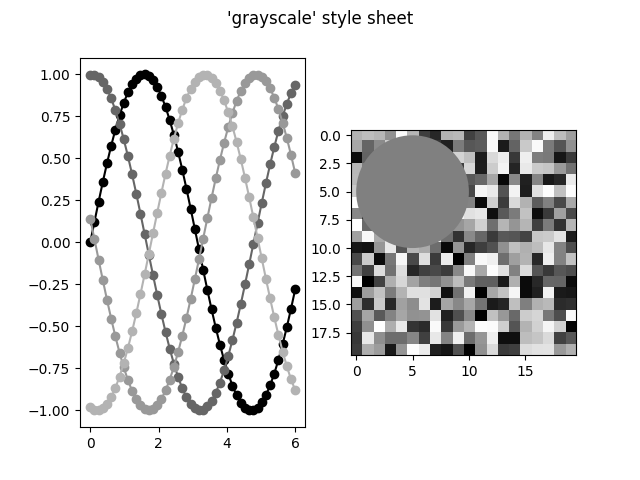
This example demonstrates the “grayscale” style sheet, which changes all colors that are defined as rc parameters to grayscale. Note, however, that not all plot elements default to colors defined by an rc parameter.
import numpy as np
import matplotlib.pyplot as plt

# Fixing random state for reproducibility
np.random.seed(19680801)


def color_cycle_example(ax):
    L = 6
    x = np.linspace(0, L)
    ncolors = len(plt.rcParams['axes.prop_cycle'])
    shift = np.linspace(0, L, ncolors, endpoint=False)
    for s in shift:
        ax.plot(x, np.sin(x + s), 'o-')


def image_and_patch_example(ax):
    ax.imshow(np.random.random(size=(20, 20)), interpolation='none')
    c = plt.Circle((5, 5), radius=5, label='patch')
    ax.add_patch(c)


plt.style.use('grayscale')

fig, (ax1, ax2) = plt.subplots(ncols=2)
fig.suptitle("'grayscale' style sheet")

color_cycle_example(ax1)
image_and_patch_example(ax2)

plt.show()
Total running time of the script: ( 0 minutes 0.106 seconds)
