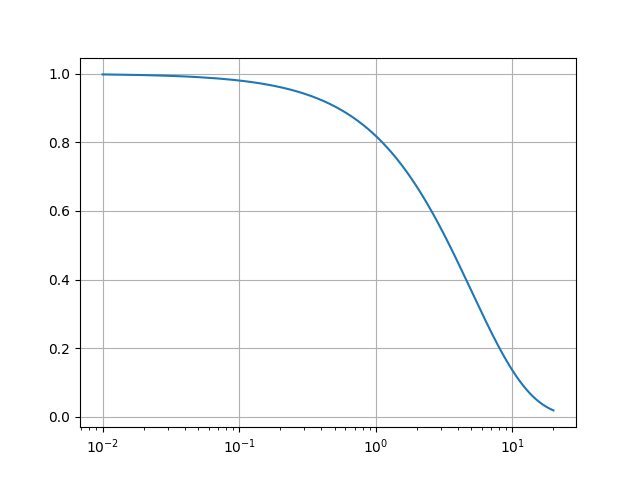
This is an example of assigning a log-scale for the x-axis using
semilogx.
import matplotlib.pyplot as plt
import numpy as np

fig, ax = plt.subplots()

dt = 0.01
t = np.arange(dt, 20.0, dt)

ax.semilogx(t, np.exp(-t / 5.0))
ax.grid()

plt.show()
Total running time of the script: ( 0 minutes 0.019 seconds)
