import numpy as np
import matplotlib.pyplot as plt
ax = plt.subplot(111)
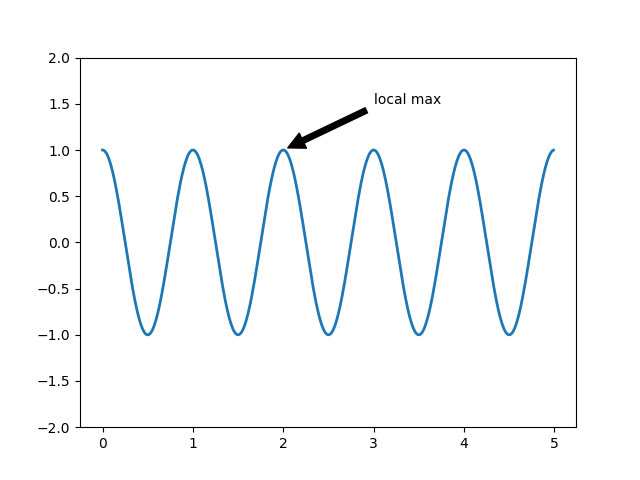
t = np.arange(0.0, 5.0, 0.01)
s = np.cos(2*np.pi*t)
line, = plt.plot(t, s, lw=2)
plt.annotate('local max', xy=(2, 1), xytext=(3, 1.5),
arrowprops=dict(facecolor='black', shrink=0.05),
)
plt.ylim(-2,2)
plt.show()
Total running time of the script: ( 0 minutes 0.018 seconds)
