import numpy as np
import matplotlib.pyplot as plt
plt.figure creates a `matplotlib.figure.Figure instance
fig = plt.figure()
rect = fig.patch # a rectangle instance
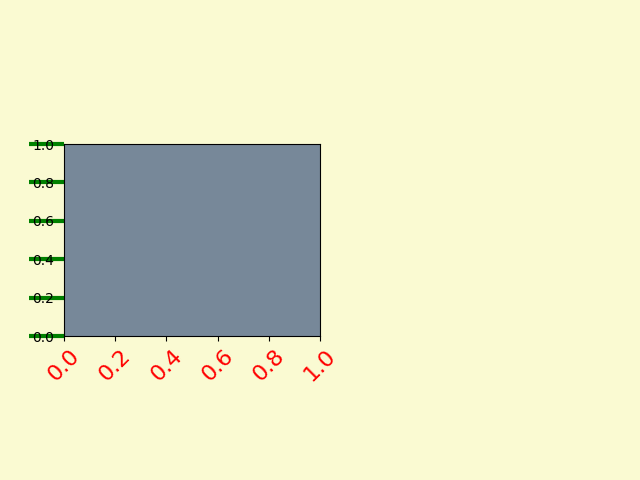
rect.set_facecolor('lightgoldenrodyellow')
ax1 = fig.add_axes([0.1, 0.3, 0.4, 0.4])
rect = ax1.patch
rect.set_facecolor('lightslategray')
for label in ax1.xaxis.get_ticklabels():
# label is a Text instance
label.set_color('red')
label.set_rotation(45)
label.set_fontsize(16)
for line in ax1.yaxis.get_ticklines():
# line is a Line2D instance
line.set_color('green')
line.set_markersize(25)
line.set_markeredgewidth(3)
plt.show()
Total running time of the script: ( 0 minutes 0.021 seconds)
