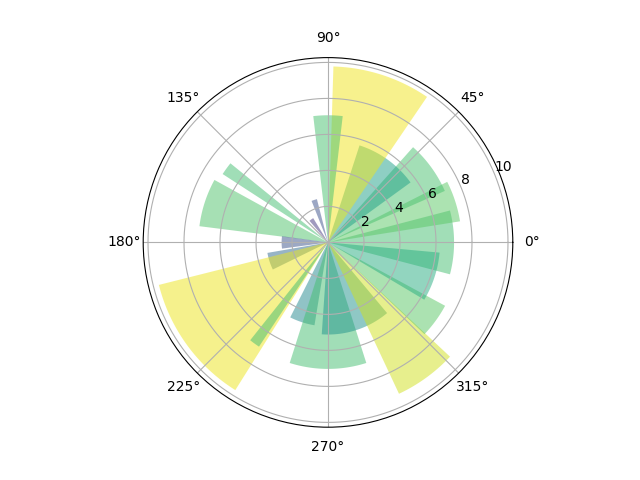
Demo of bar plot on a polar axis.
import numpy as np
import matplotlib.pyplot as plt


# Fixing random state for reproducibility
np.random.seed(19680801)

# Compute pie slices
N = 20
theta = np.linspace(0.0, 2 * np.pi, N, endpoint=False)
radii = 10 * np.random.rand(N)
width = np.pi / 4 * np.random.rand(N)

ax = plt.subplot(111, projection='polar')
bars = ax.bar(theta, radii, width=width, bottom=0.0)

# Use custom colors and opacity
for r, bar in zip(radii, bars):
    bar.set_facecolor(plt.cm.viridis(r / 10.))
    bar.set_alpha(0.5)

plt.show()
Total running time of the script: ( 0 minutes 0.022 seconds)
