import matplotlib.pyplot as plt
import numpy as np
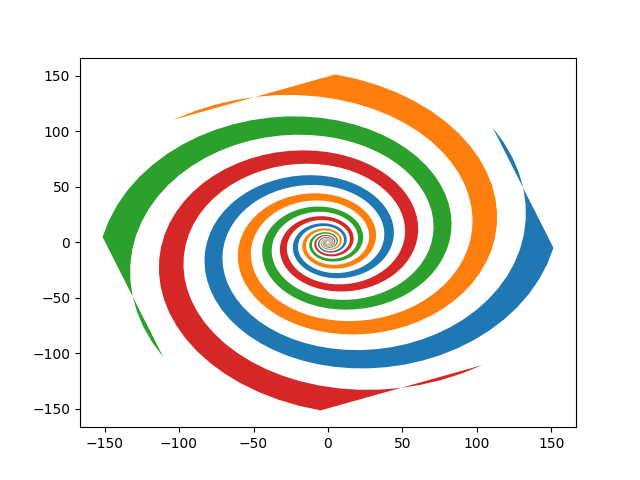
theta = np.arange(0, 8*np.pi, 0.1)
a = 1
b = .2
for dt in np.arange(0, 2*np.pi, np.pi/2.0):
x = a*np.cos(theta + dt)*np.exp(b*theta)
y = a*np.sin(theta + dt)*np.exp(b*theta)
dt = dt + np.pi/4.0
x2 = a*np.cos(theta + dt)*np.exp(b*theta)
y2 = a*np.sin(theta + dt)*np.exp(b*theta)
xf = np.concatenate((x, x2[::-1]))
yf = np.concatenate((y, y2[::-1]))
p1 = plt.fill(xf, yf)
plt.show()
Total running time of the script: ( 0 minutes 0.020 seconds)
