You are reading an old version of the documentation (v2.1.0). For the latest version see https://matplotlib.org/stable/gallery/lines_bars_and_markers/stem_plot.html
matplotlib
Fork me on GitHub


Travis-CI:

Related Topics

This Page

Stem PlotΒΆ

Example stem plot.

../../_images/sphx_glr_stem_plot_001.png
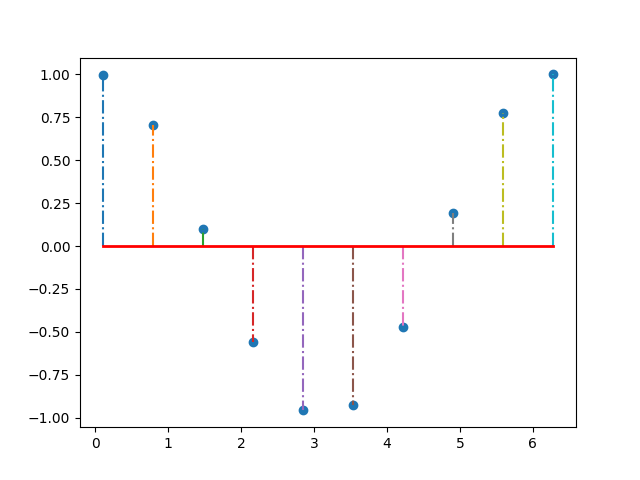
import matplotlib.pyplot as plt
import numpy as np

x = np.linspace(0.1, 2 * np.pi, 10)
markerline, stemlines, baseline = plt.stem(x, np.cos(x), '-.')
plt.setp(baseline, 'color', 'r', 'linewidth', 2)

plt.show()

Total running time of the script: ( 0 minutes 0.027 seconds)

Gallery generated by Sphinx-Gallery