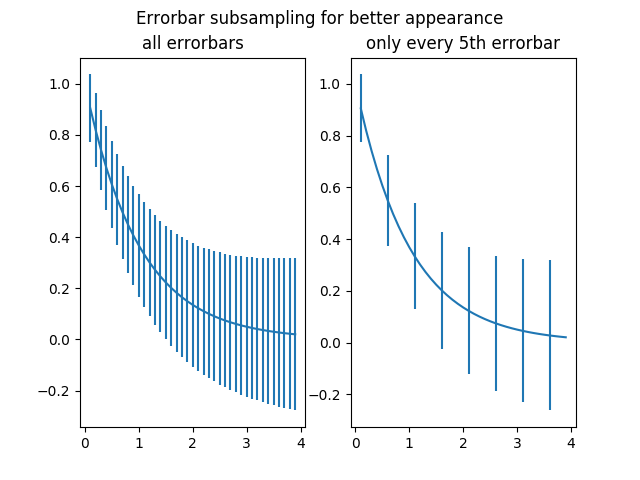
Demo for the errorevery keyword to show data full accuracy data plots with few errorbars.
import numpy as np
import matplotlib.pyplot as plt

# example data
x = np.arange(0.1, 4, 0.1)
y = np.exp(-x)

# example variable error bar values
yerr = 0.1 + 0.1 * np.sqrt(x)


# Now switch to a more OO interface to exercise more features.
fig, axs = plt.subplots(nrows=1, ncols=2, sharex=True)
ax = axs[0]
ax.errorbar(x, y, yerr=yerr)
ax.set_title('all errorbars')

ax = axs[1]
ax.errorbar(x, y, yerr=yerr, errorevery=5)
ax.set_title('only every 5th errorbar')


fig.suptitle('Errorbar subsampling for better appearance')

plt.show()
Total running time of the script: ( 0 minutes 0.037 seconds)
