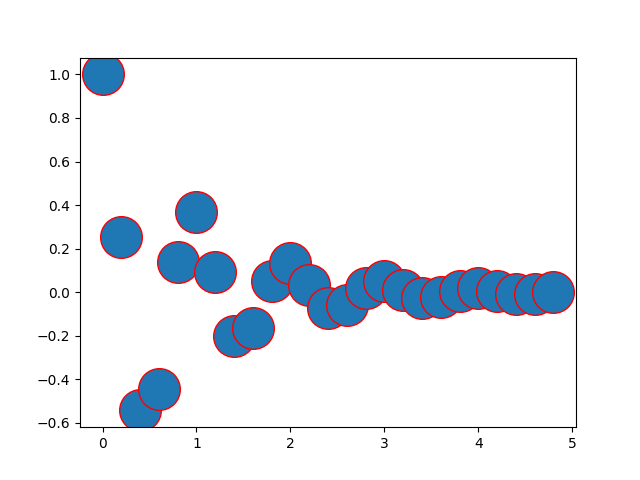
import matplotlib.pyplot as plt
import numpy as np


def f(t):
    'A damped exponential'
    s1 = np.cos(2 * np.pi * t)
    e1 = np.exp(-t)
    return s1 * e1


t1 = np.arange(0.0, 5.0, .2)

l = plt.plot(t1, f(t1), 'ro')
plt.setp(l, 'markersize', 30)
plt.setp(l, 'markerfacecolor', 'C0')

plt.show()
Total running time of the script: ( 0 minutes 0.018 seconds)
Gallery generated by Sphinx-Gallery