Pseudocolor plots of unstructured triangular grids.
import matplotlib.pyplot as plt
import matplotlib.tri as tri
import numpy as np
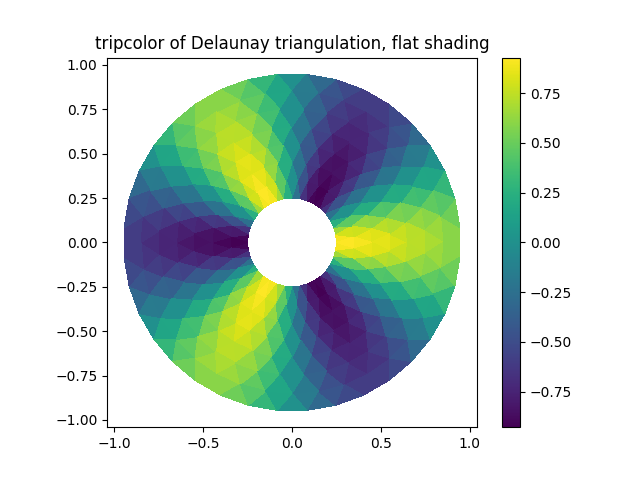
Creating a Triangulation without specifying the triangles results in the Delaunay triangulation of the points.
# First create the x and y coordinates of the points.
n_angles = 36
n_radii = 8
min_radius = 0.25
radii = np.linspace(min_radius, 0.95, n_radii)

angles = np.linspace(0, 2 * np.pi, n_angles, endpoint=False)
angles = np.repeat(angles[..., np.newaxis], n_radii, axis=1)
angles[:, 1::2] += np.pi / n_angles

x = (radii * np.cos(angles)).flatten()
y = (radii * np.sin(angles)).flatten()
z = (np.cos(radii) * np.cos(3 * angles)).flatten()

# Create the Triangulation; no triangles so Delaunay triangulation created.
triang = tri.Triangulation(x, y)

# Mask off unwanted triangles.
triang.set_mask(np.hypot(x[triang.triangles].mean(axis=1),
                         y[triang.triangles].mean(axis=1))
                < min_radius)
tripcolor plot.
plt.figure()
plt.gca().set_aspect('equal')
plt.tripcolor(triang, z, shading='flat')
plt.colorbar()
plt.title('tripcolor of Delaunay triangulation, flat shading')
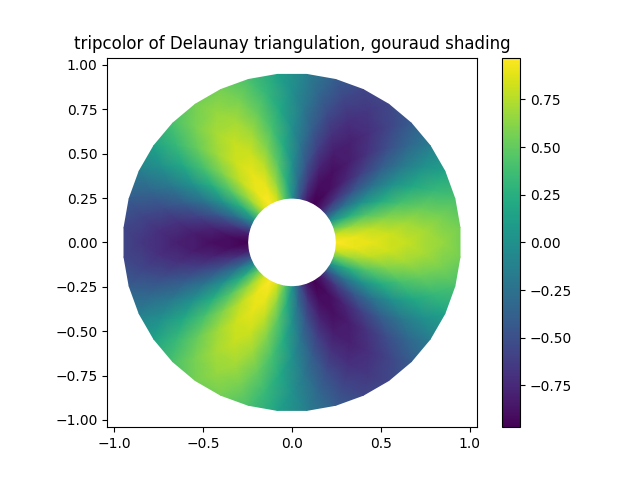
Illustrate Gouraud shading.
plt.figure()
plt.gca().set_aspect('equal')
plt.tripcolor(triang, z, shading='gouraud')
plt.colorbar()
plt.title('tripcolor of Delaunay triangulation, gouraud shading')
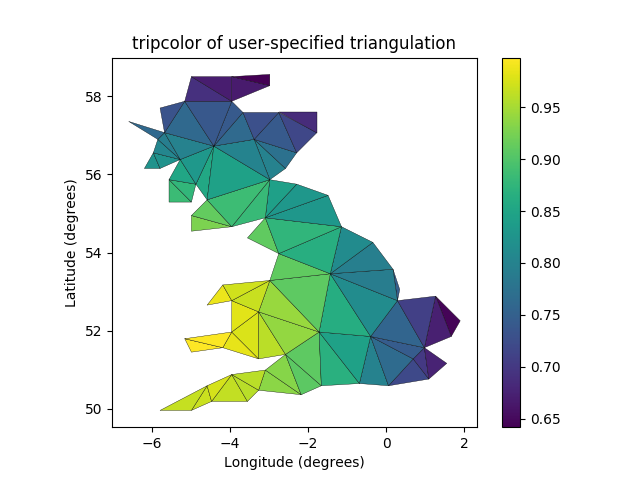
You can specify your own triangulation rather than perform a Delaunay triangulation of the points, where each triangle is given by the indices of the three points that make up the triangle, ordered in either a clockwise or anticlockwise manner.
xy = np.asarray([
    [-0.101, 0.872], [-0.080, 0.883], [-0.069, 0.888], [-0.054, 0.890],
    [-0.045, 0.897], [-0.057, 0.895], [-0.073, 0.900], [-0.087, 0.898],
    [-0.090, 0.904], [-0.069, 0.907], [-0.069, 0.921], [-0.080, 0.919],
    [-0.073, 0.928], [-0.052, 0.930], [-0.048, 0.942], [-0.062, 0.949],
    [-0.054, 0.958], [-0.069, 0.954], [-0.087, 0.952], [-0.087, 0.959],
    [-0.080, 0.966], [-0.085, 0.973], [-0.087, 0.965], [-0.097, 0.965],
    [-0.097, 0.975], [-0.092, 0.984], [-0.101, 0.980], [-0.108, 0.980],
    [-0.104, 0.987], [-0.102, 0.993], [-0.115, 1.001], [-0.099, 0.996],
    [-0.101, 1.007], [-0.090, 1.010], [-0.087, 1.021], [-0.069, 1.021],
    [-0.052, 1.022], [-0.052, 1.017], [-0.069, 1.010], [-0.064, 1.005],
    [-0.048, 1.005], [-0.031, 1.005], [-0.031, 0.996], [-0.040, 0.987],
    [-0.045, 0.980], [-0.052, 0.975], [-0.040, 0.973], [-0.026, 0.968],
    [-0.020, 0.954], [-0.006, 0.947], [ 0.003, 0.935], [ 0.006, 0.926],
    [ 0.005, 0.921], [ 0.022, 0.923], [ 0.033, 0.912], [ 0.029, 0.905],
    [ 0.017, 0.900], [ 0.012, 0.895], [ 0.027, 0.893], [ 0.019, 0.886],
    [ 0.001, 0.883], [-0.012, 0.884], [-0.029, 0.883], [-0.038, 0.879],
    [-0.057, 0.881], [-0.062, 0.876], [-0.078, 0.876], [-0.087, 0.872],
    [-0.030, 0.907], [-0.007, 0.905], [-0.057, 0.916], [-0.025, 0.933],
    [-0.077, 0.990], [-0.059, 0.993]])
x, y = np.rad2deg(xy).T

triangles = np.asarray([
    [67, 66,  1], [65,  2, 66], [ 1, 66,  2], [64,  2, 65], [63,  3, 64],
    [60, 59, 57], [ 2, 64,  3], [ 3, 63,  4], [ 0, 67,  1], [62,  4, 63],
    [57, 59, 56], [59, 58, 56], [61, 60, 69], [57, 69, 60], [ 4, 62, 68],
    [ 6,  5,  9], [61, 68, 62], [69, 68, 61], [ 9,  5, 70], [ 6,  8,  7],
    [ 4, 70,  5], [ 8,  6,  9], [56, 69, 57], [69, 56, 52], [70, 10,  9],
    [54, 53, 55], [56, 55, 53], [68, 70,  4], [52, 56, 53], [11, 10, 12],
    [69, 71, 68], [68, 13, 70], [10, 70, 13], [51, 50, 52], [13, 68, 71],
    [52, 71, 69], [12, 10, 13], [71, 52, 50], [71, 14, 13], [50, 49, 71],
    [49, 48, 71], [14, 16, 15], [14, 71, 48], [17, 19, 18], [17, 20, 19],
    [48, 16, 14], [48, 47, 16], [47, 46, 16], [16, 46, 45], [23, 22, 24],
    [21, 24, 22], [17, 16, 45], [20, 17, 45], [21, 25, 24], [27, 26, 28],
    [20, 72, 21], [25, 21, 72], [45, 72, 20], [25, 28, 26], [44, 73, 45],
    [72, 45, 73], [28, 25, 29], [29, 25, 31], [43, 73, 44], [73, 43, 40],
    [72, 73, 39], [72, 31, 25], [42, 40, 43], [31, 30, 29], [39, 73, 40],
    [42, 41, 40], [72, 33, 31], [32, 31, 33], [39, 38, 72], [33, 72, 38],
    [33, 38, 34], [37, 35, 38], [34, 38, 35], [35, 37, 36]])

xmid = x[triangles].mean(axis=1)
ymid = y[triangles].mean(axis=1)
x0 = -5
y0 = 52
zfaces = np.exp(-0.01 * ((xmid - x0) * (xmid - x0) +
                         (ymid - y0) * (ymid - y0)))
Rather than create a Triangulation object, can simply pass x, y and triangles arrays to tripcolor directly. It would be better to use a Triangulation object if the same triangulation was to be used more than once to save duplicated calculations. Can specify one color value per face rather than one per point by using the facecolors kwarg.
plt.figure()
plt.gca().set_aspect('equal')
plt.tripcolor(x, y, triangles, facecolors=zfaces, edgecolors='k')
plt.colorbar()
plt.title('tripcolor of user-specified triangulation')
plt.xlabel('Longitude (degrees)')
plt.ylabel('Latitude (degrees)')

plt.show()
Total running time of the script: ( 0 minutes 0.129 seconds)
