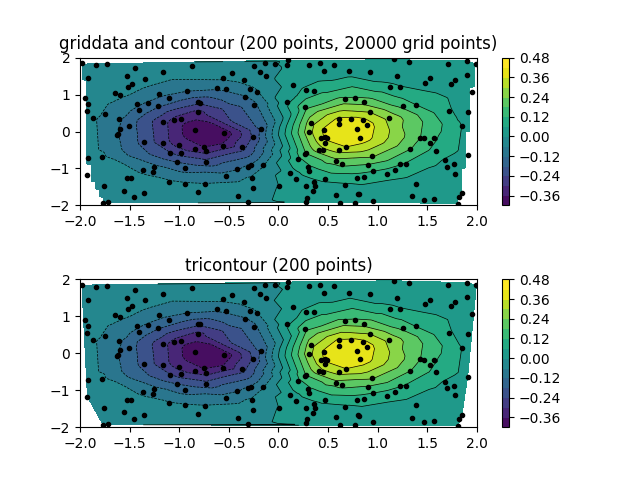
Comparison of griddata and tricontour for an unstructured triangular grid.
Out:
griddata and contour: 0.059032 seconds
tricontour: 0.049517 seconds
from __future__ import print_function
import matplotlib.pyplot as plt
import matplotlib.tri as tri
import numpy as np
import matplotlib.mlab as mlab
import time

np.random.seed(0)
npts = 200
ngridx = 100
ngridy = 200
x = np.random.uniform(-2, 2, npts)
y = np.random.uniform(-2, 2, npts)
z = x * np.exp(-x**2 - y**2)

# griddata and contour.
start = time.clock()
plt.subplot(211)
xi = np.linspace(-2.1, 2.1, ngridx)
yi = np.linspace(-2.1, 2.1, ngridy)
zi = mlab.griddata(x, y, z, xi, yi, interp='linear')
plt.contour(xi, yi, zi, 15, linewidths=0.5, colors='k')
plt.contourf(xi, yi, zi, 15,
             norm=plt.Normalize(vmax=abs(zi).max(), vmin=-abs(zi).max()))
plt.colorbar()  # draw colorbar
plt.plot(x, y, 'ko', ms=3)
plt.xlim(-2, 2)
plt.ylim(-2, 2)
plt.title('griddata and contour (%d points, %d grid points)' %
          (npts, ngridx * ngridy))
print('griddata and contour: %f seconds' % (time.clock() - start))

# tricontour.
start = time.clock()
plt.subplot(212)
triang = tri.Triangulation(x, y)
plt.tricontour(x, y, z, 15, linewidths=0.5, colors='k')
plt.tricontourf(x, y, z, 15,
                norm=plt.Normalize(vmax=abs(zi).max(), vmin=-abs(zi).max()))
plt.colorbar()
plt.plot(x, y, 'ko', ms=3)
plt.xlim(-2, 2)
plt.ylim(-2, 2)
plt.title('tricontour (%d points)' % npts)
print('tricontour: %f seconds' % (time.clock() - start))

plt.subplots_adjust(hspace=0.5)

plt.show()
Total running time of the script: ( 0 minutes 0.110 seconds)
