from matplotlib.mlab import griddata
import matplotlib.pyplot as plt
import numpy as np
# make up data.
random_state = np.random.RandomState(19680801)
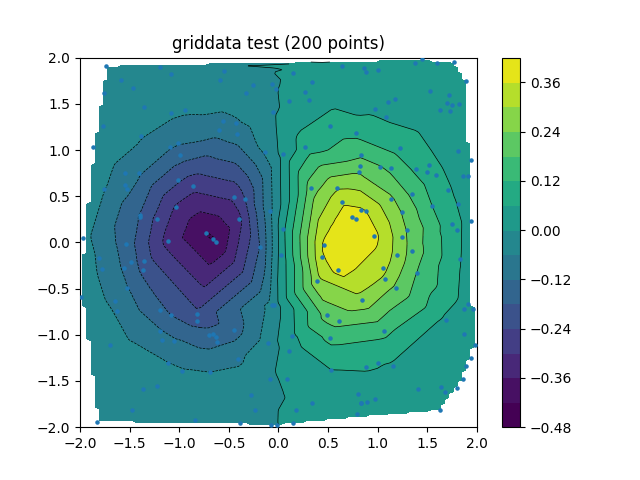
npts = 200
x = random_state.uniform(-2, 2, npts)
y = random_state.uniform(-2, 2, npts)
z = x*np.exp(-x**2 - y**2)
# define grid.
xi = np.linspace(-2.1, 2.1, 100)
yi = np.linspace(-2.1, 2.1, 200)
# grid the data.
zi = griddata(x, y, z, xi, yi, interp='linear')
# contour the gridded data, plotting dots at the nonuniform data points.
CS = plt.contour(xi, yi, zi, 15, linewidths=0.5, colors='k')
CS = plt.contourf(xi, yi, zi, 15,
vmax=abs(zi).max(), vmin=-abs(zi).max())
plt.colorbar() # draw colorbar
# plot data points.
plt.scatter(x, y, marker='o', s=5, zorder=10)
plt.xlim(-2, 2)
plt.ylim(-2, 2)
plt.title('griddata test (%d points)' % npts)
plt.show()
Total running time of the script: ( 0 minutes 0.060 seconds)
