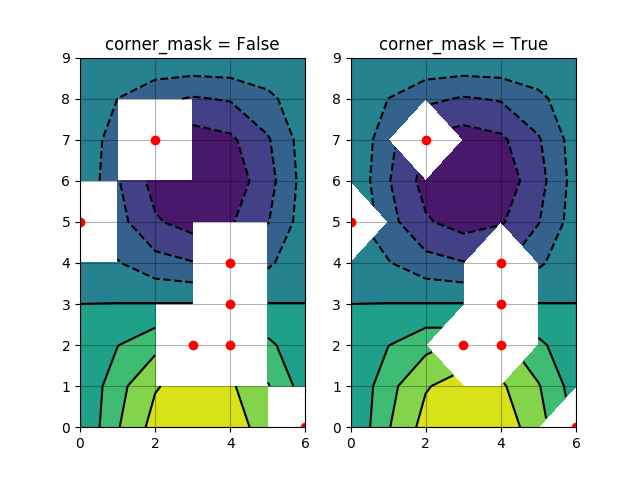
Illustrate the difference between corner_mask=False and corner_mask=True for masked contour plots.
import matplotlib.pyplot as plt
import numpy as np

# Data to plot.
x, y = np.meshgrid(np.arange(7), np.arange(10))
z = np.sin(0.5 * x) * np.cos(0.52 * y)

# Mask various z values.
mask = np.zeros_like(z, dtype=bool)
mask[2, 3:5] = True
mask[3:5, 4] = True
mask[7, 2] = True
mask[5, 0] = True
mask[0, 6] = True
z = np.ma.array(z, mask=mask)

corner_masks = [False, True]
for i, corner_mask in enumerate(corner_masks):
    plt.subplot(1, 2, i + 1)
    cs = plt.contourf(x, y, z, corner_mask=corner_mask)
    plt.contour(cs, colors='k')
    plt.title('corner_mask = {0}'.format(corner_mask))

    # Plot grid.
    plt.grid(c='k', ls='-', alpha=0.3)

    # Indicate masked points with red circles.
    plt.plot(np.ma.array(x, mask=~mask), y, 'ro')

plt.show()
Total running time of the script: ( 0 minutes 0.054 seconds)
