matplotlib gives you 5 ways to specify colors,
- as a single letter string, ala MATLAB
- as an html style hex string or html color name
- as an R,G,B tuple, where R,G,B, range from 0-1
- as a string representing a floating point number from 0 to 1, corresponding to shades of gray.
- as a special color “Cn”, where n is a number 0-9 specifying the nth color in the currently active color cycle.
See help(colors) for more info.
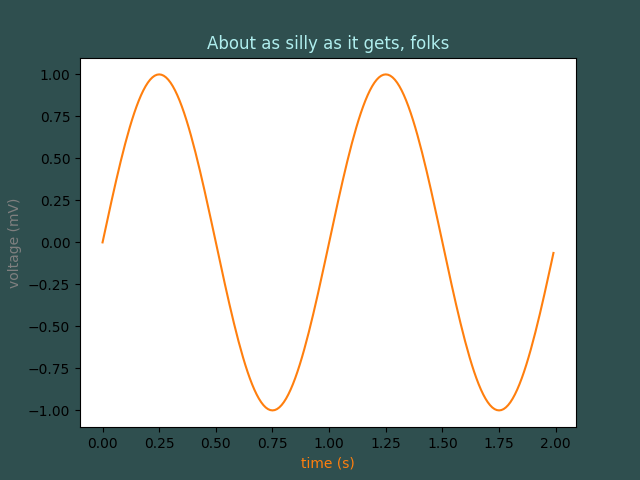
import matplotlib.pyplot as plt
import numpy as np

t = np.arange(0.0, 2.0, 0.01)
s = np.sin(2 * np.pi * t)

fig, ax = plt.subplots(facecolor='darkslategray')
ax.plot(t, s, 'C1')
ax.set_xlabel('time (s)', color='C1')
ax.set_ylabel('voltage (mV)', color='0.5')  # grayscale color
ax.set_title('About as silly as it gets, folks', color='#afeeee')

plt.show()
Total running time of the script: ( 0 minutes 0.018 seconds)
