Axis within rectangular frame
The following code demonstrates how to put a floating polar curve within a rectangular box. In order to get a better sense of polar curves, please look at demo_curvelinear_grid.py.
import numpy as np
import matplotlib.pyplot as plt
import mpl_toolkits.axisartist.angle_helper as angle_helper
from matplotlib.projections import PolarAxes
from matplotlib.transforms import Affine2D
from mpl_toolkits.axisartist import SubplotHost
from mpl_toolkits.axisartist import GridHelperCurveLinear
def curvelinear_test2(fig):
"""
polar projection, but in a rectangular box.
"""
global ax1
# see demo_curvelinear_grid.py for details
tr = Affine2D().scale(np.pi / 180., 1.) + PolarAxes.PolarTransform()
extreme_finder = angle_helper.ExtremeFinderCycle(20,
20,
lon_cycle=360,
lat_cycle=None,
lon_minmax=None,
lat_minmax=(0,
np.inf),
)
grid_locator1 = angle_helper.LocatorDMS(12)
tick_formatter1 = angle_helper.FormatterDMS()
grid_helper = GridHelperCurveLinear(tr,
extreme_finder=extreme_finder,
grid_locator1=grid_locator1,
tick_formatter1=tick_formatter1
)
ax1 = SubplotHost(fig, 1, 1, 1, grid_helper=grid_helper)
fig.add_subplot(ax1)
# Now creates floating axis
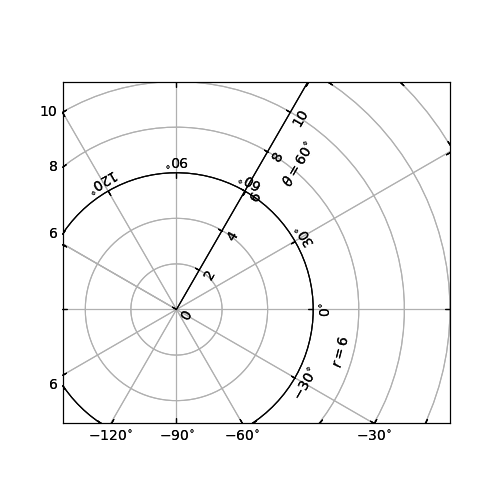
# floating axis whose first coordinate (theta) is fixed at 60
ax1.axis["lat"] = axis = ax1.new_floating_axis(0, 60)
axis.label.set_text(r"$\theta = 60^{\circ}$")
axis.label.set_visible(True)
# floating axis whose second coordinate (r) is fixed at 6
ax1.axis["lon"] = axis = ax1.new_floating_axis(1, 6)
axis.label.set_text(r"$r = 6$")
ax1.set_aspect(1.)
ax1.set_xlim(-5, 12)
ax1.set_ylim(-5, 10)
ax1.grid(True)
fig = plt.figure(1, figsize=(5, 5))
fig.clf()
curvelinear_test2(fig)
plt.show()
Total running time of the script: ( 0 minutes 0.025 seconds)
