matplotlib.pyplot.yscale(*args, **kwargs)¶Set the scaling of the y-axis.
call signature:
yscale(scale, **kwargs)
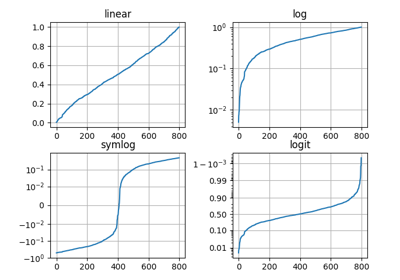
The available scales are: ‘linear’ | ‘log’ | ‘logit’ | ‘symlog’
Different keywords may be accepted, depending on the scale:
‘linear’
‘log’
- basex/basey:
- The base of the logarithm
- nonposx/nonposy: [‘mask’ | ‘clip’ ]
- non-positive values in x or y can be masked as invalid, or clipped to a very small positive number
- subsx/subsy:
Where to place the subticks between each major tick. Should be a sequence of integers. For example, in a log10 scale:
[2, 3, 4, 5, 6, 7, 8, 9]will place 8 logarithmically spaced minor ticks between each major tick.
‘logit’
- nonpos: [‘mask’ | ‘clip’ ]
- values beyond ]0, 1[ can be masked as invalid, or clipped to a number very close to 0 or 1
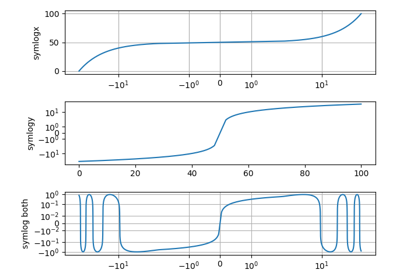
‘symlog’
- basex/basey:
- The base of the logarithm
- linthreshx/linthreshy:
- A single float which defines the range (-x, x), within which the plot is linear. This avoids having the plot go to infinity around zero.
- subsx/subsy:
Where to place the subticks between each major tick. Should be a sequence of integers. For example, in a log10 scale:
[2, 3, 4, 5, 6, 7, 8, 9]will place 8 logarithmically spaced minor ticks between each major tick.
- linscalex/linscaley:
- This allows the linear range (-linthresh to linthresh) to be stretched relative to the logarithmic range. Its value is the number of decades to use for each half of the linear range. For example, when linscale == 1.0 (the default), the space used for the positive and negative halves of the linear range will be equal to one decade in the logarithmic range.