matplotlib.pyplot.tight_layout
matplotlib.pyplot.
tight_layout
Automatically adjust subplot parameters to give specified padding.
Parameters:
pad_inches
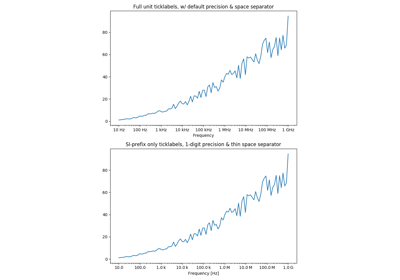
Labeling ticks using engineering notation
Demo Tight Layout
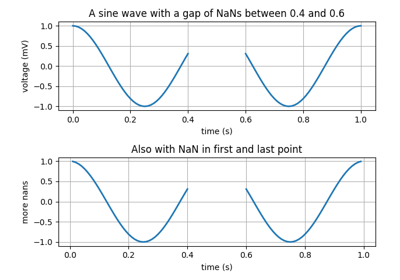
Nan Test
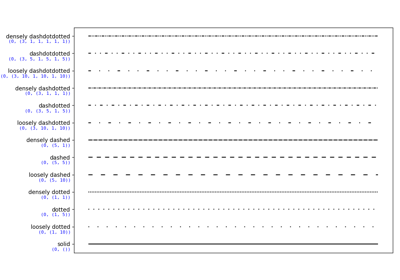
Linestyles
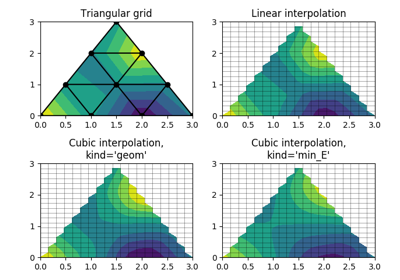
Triinterp Demo
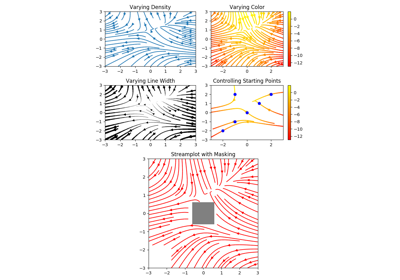
Streamplot
Contour Image
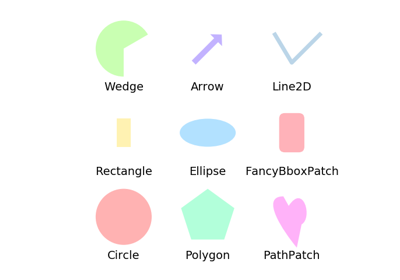
Reference for matplotlib artists
Figure legend demo
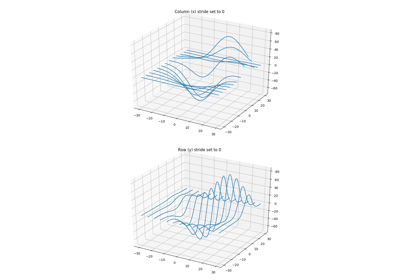
3D wireframe plots in one direction
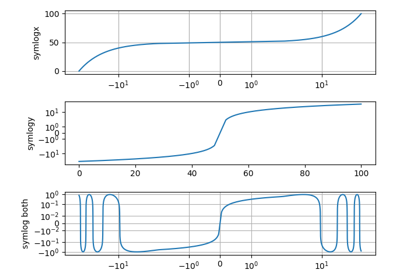
Symlog Demo
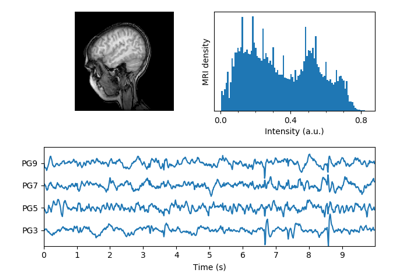
MRI With EEG
Pgf Texsystem
Pgf Fonts
Pgf Preamble
Tight Layout guide