You are reading an old version of the documentation (v2.1.0). For the latest version see https://matplotlib.org/stable/api/_as_gen/matplotlib.pyplot.step.html
matplotlib
Fork me on GitHub


Travis-CI:

Table Of Contents

This Page

matplotlib.pyplot.step

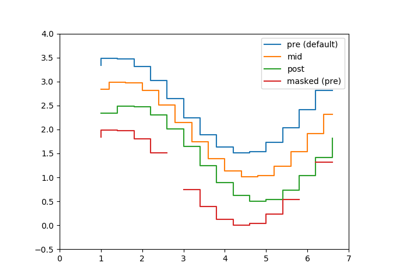
matplotlib.pyplot.step(x, y, *args, **kwargs)

Make a step plot.

Parameters:

x : array_like

1-D sequence, and it is assumed, but not checked, that it is uniformly increasing.

y : array_like

1-D sequence

Returns:

list

List of lines that were added.

Other Parameters:
 

where : [ ‘pre’ | ‘post’ | ‘mid’ ]

If ‘pre’ (the default), the interval from x[i] to x[i+1] has level y[i+1].

If ‘post’, that interval has level y[i].

If ‘mid’, the jumps in y occur half-way between the x-values.

Notes

Additional parameters are the same as those for plot().

Note

In addition to the above described arguments, this function can take a data keyword argument. If such a data argument is given, the following arguments are replaced by data[<arg>]:

  • All arguments with the following names: ‘x’, ‘y’.

Examples using matplotlib.pyplot.step